


Binomial Distribution Calculator
This calculator will help you to obtain the binomial distribution with steps for given values of trials, successes and probability of success.Related Calculator:Beta Distribution Calculator

Neetesh Kumar | January 11, 2025
Share this Page on:
![]()
![]()
![]()
![]()
![]()
- 1. Introduction to the Binomial Distribution Calculator
- 2. What is the Formulae used
- 3. How do I find the Binomial Distribution?
- 4. Why choose our Binomial Distribution Calculator?
- 5. A Video for explaining this concept
- 6. How to use this calculator?
- 7. Solved Examples on Binomial Distribution
- 8. Frequently Asked Questions (FAQs)
- 9. What are the real-life applications?
- 10. Conclusion
The Binomial Distribution is a cornerstone in probability and statistics, helping you model scenarios where outcomes are binary (success or failure). The Binomial Distribution Calculator for a Table streamlines these calculations, providing accurate probabilities in seconds. Whether you're a student, researcher, or data analyst, this tool simplifies probability calculations and saves time.
1. Introduction to the Binomial Distribution Calculator
The Binomial Distribution models the probability of achieving a specific number of successes in a fixed number of trials, given a constant probability of success. It’s widely used in fields such as business, healthcare, and education to analyze success rates, survey responses, and experimental results.
Our Binomial Distribution Calculator is optimized for tabular data, allowing you to compute individual probabilities, cumulative probabilities, and more with ease. From tossing coins to product defect analysis, this tool is a must-have for probability enthusiasts.
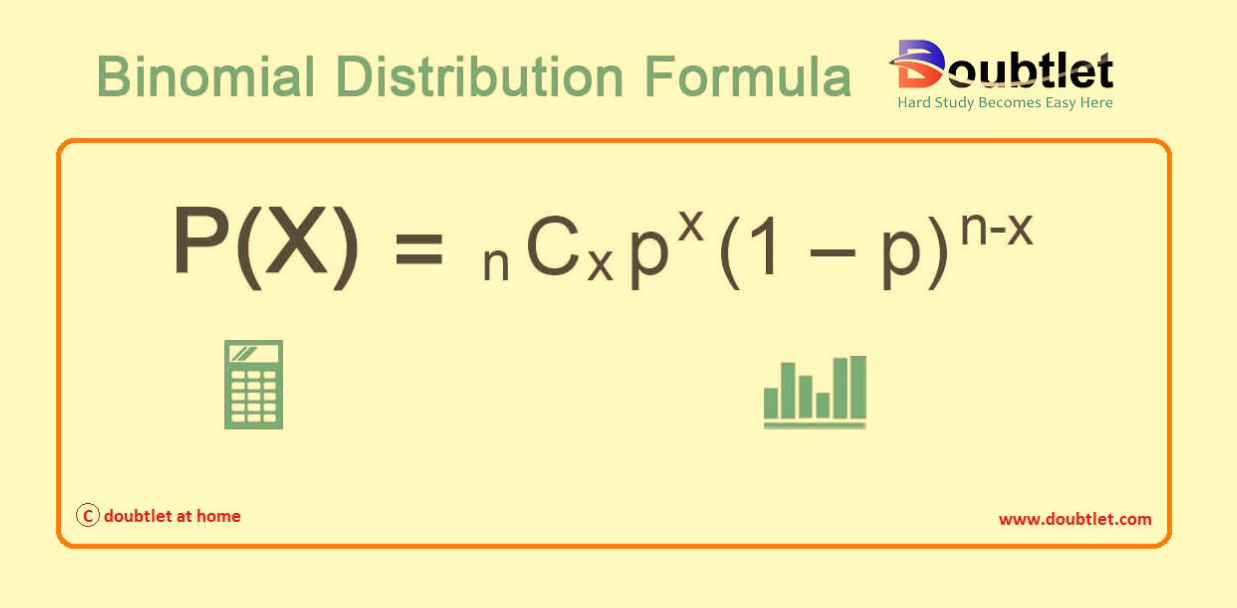
2. What is the Formulae used?
The formula for the Binomial Distribution is:
Where:
-
: Probability of successes in trials.
-
: Binomial coefficient .
-
: Probability of success in a single trial.
-
: Probability of failure in a single trial.
Cumulative Probability:
The cumulative probability is the sum of probabilities up to :
What Is the Binomial Distribution Formula?
The binomial distribution formula for any random variable is given by:
Where:
- : The number of experiments.
- : Probability of success in a single experiment.
- : Probability of failure in a single experiment .
The binomial distribution formula can also be expressed in terms of -Bernoulli trials as:
Thus:

What is Binomial Distribution Formula?
The binomial distribution formula calculates the probability of getting successes in trials of an independent binomial experiment. The probability is derived as a combination of the number of trials.
First, the number of successes is represented by . Then, it is multiplied by the probability of success raised to the power of the number of successes, represented by . Further, it is multiplied by the probability of failure raised to the power of the difference between the number of successes and the number of trials, represented by .
Binomial distribution formula statistics is represented by . Further, it is multiplied by the probability of failure raised to the power of the difference between the number of successes and the number of trials, represented by . This helps researchers and analysts determine one of the two independent values that can arise out of the experiment.
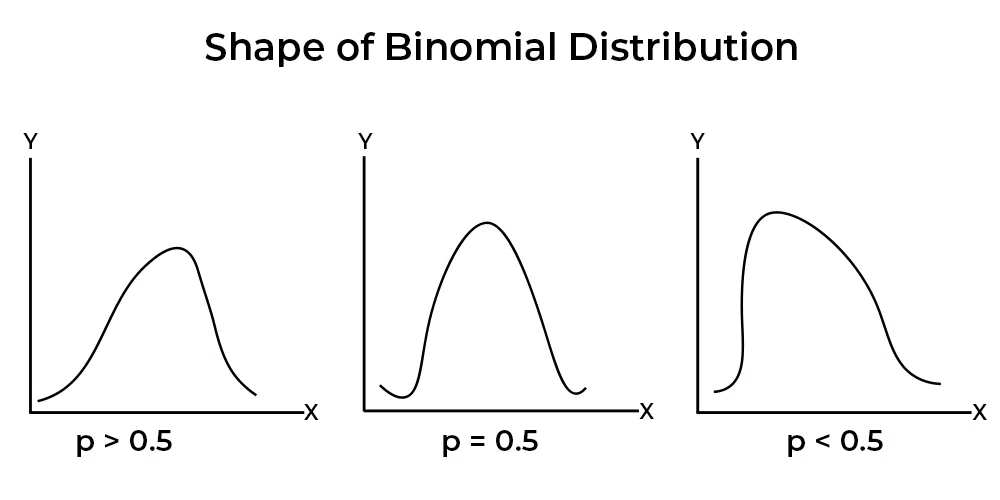
Shape of Binomial Distribution
Binomial Distribution may be symmetrical or skewed. If the probability of success, , is equal to , then the binomial distribution would be symmetrical, regardless of the value of . If the distribution will be positively skewed; while for , the distribution will be negatively skewed. Further, for a given value of , the greater the departure from , the greater is the degree of skewness.
3. How Do I Find the Binomial Distribution?
To calculate binomial probabilities manually:
-
Define Parameters: Identify (number of trials), (number of successes), and (probability of success).
-
Compute the Binomial Coefficient:
-
Apply the Formula: Substitute , , and into the binomial formula.
-
Calculate Cumulative Probabilities (if needed): Sum probabilities for all .
Example:
A survey asks people if they like a product. If (% probability of liking), what’s the probability exactly people like it?
Steps:
For larger datasets or cumulative probabilities, manual calculations can be tedious, but our calculator simplifies this process.
Example:
Let's explain the Binomial Distribution graph solution for and :
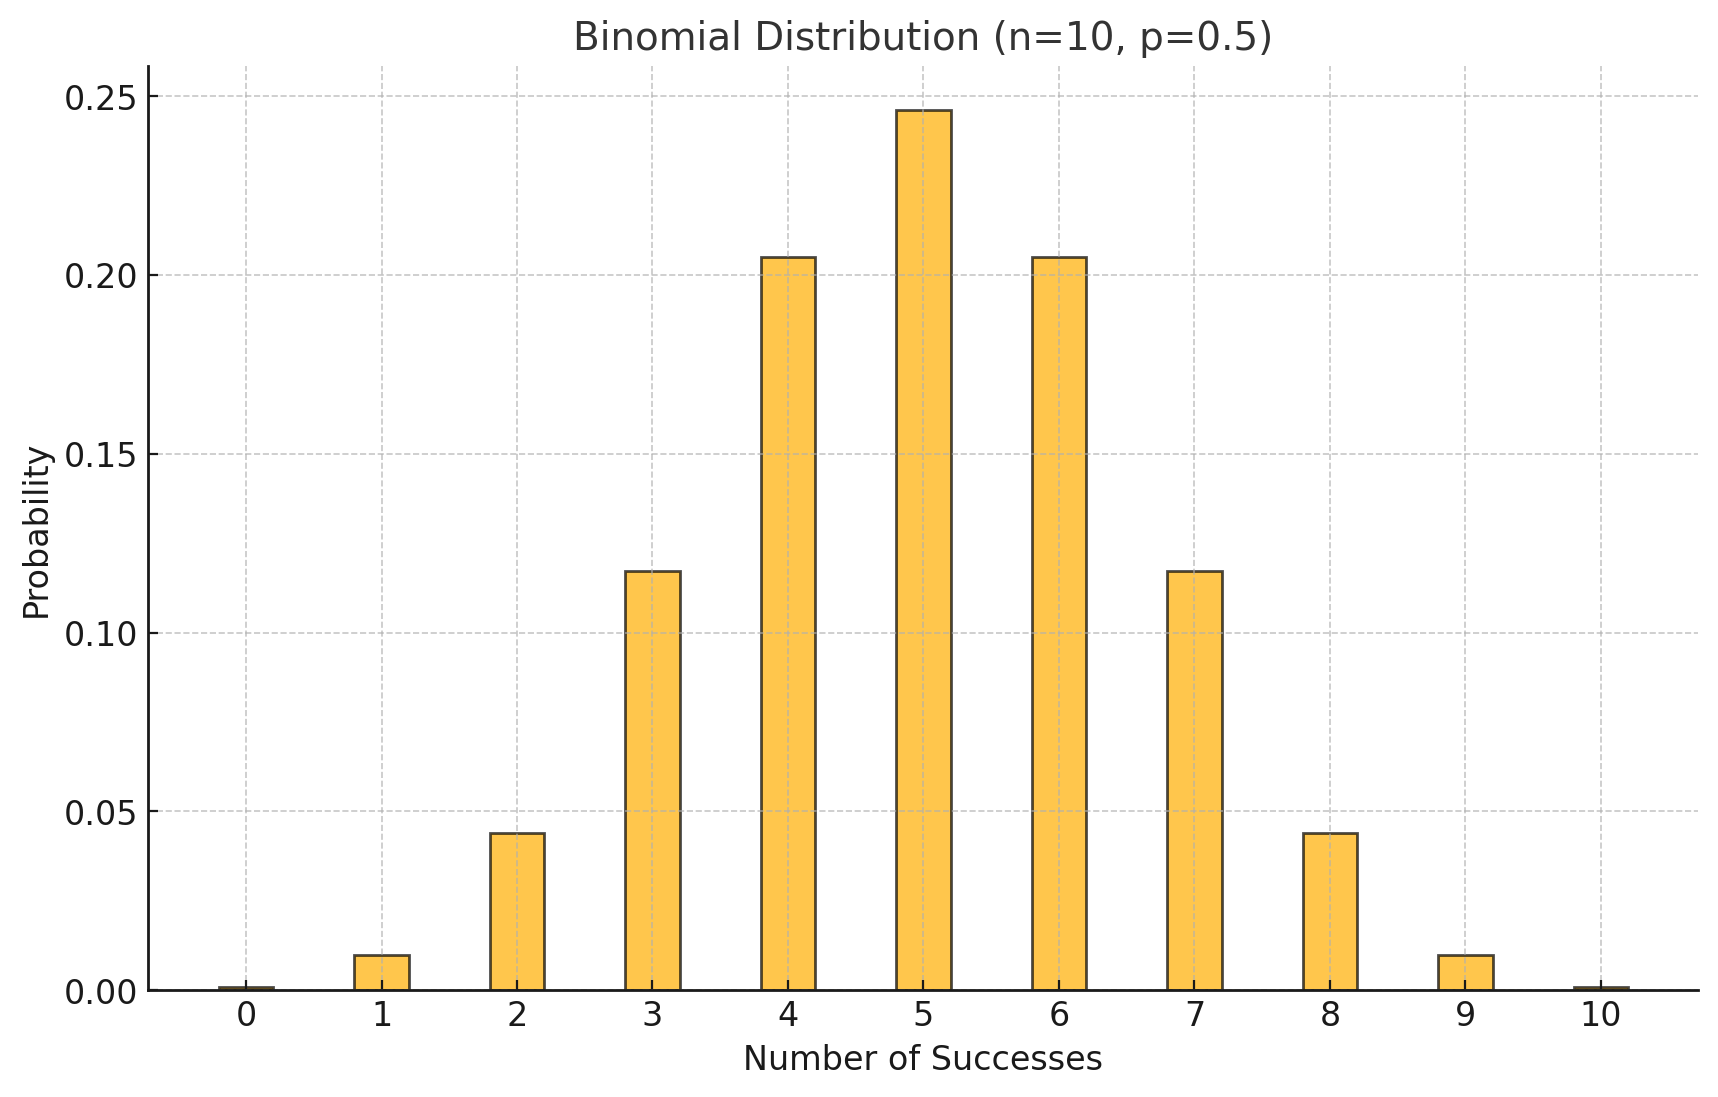
Here is the graph of the Binomial Distribution for trials and a probability of success . The x-axis represents the number of successes, and the y-axis shows the probability of each outcome.
Let me know if you'd like further explanations or calculations!
Parameters:
- : Total number of trials.
- : Probability of success in each trial.
The Probability Mass Function (PMF) of the Binomial Distribution is:
Where:
- : Number of successes ),
- : Number of ways to choose successes in trials.
Solution:
We calculate for .
Step 1: Compute probabilities for each :
-
-
-
-
-
-
-
Similarly, compute for to (symmetric due to ).
Step 2: Verify Total Probability
The sum of all probabilities must equal :
Step 3: Explanation of the Graph
- The x-axis represents (number of successes).
- The y-axis represents the probability .
- The peak occurs at , where is highest .
- The distribution is symmetric because .
The graph visually represents the likelihood of each outcome. For example:
- : The most probable outcome is successes.
- : The least probable outcome is successes.
Let me know if you'd like step-by-step probabilities for all values of !
Example:
A factory produces light bulbs. The probability that a bulb is defective is . Out of 10 bulbs produced in a batch ), find the probabilities for the following cases:
- Exactly defective bulbs .
- At most defective bulbs .
- At least defective bulbs .
Finally, plot the Binomial Distribution graph.
Solution:
- Probability Mass Function (PMF):
The formula for the Binomial Distribution is:
Where:
- : Total number of trials,
- : Probability of success,
- : Number of successes,
- : Probability of failure.
- Case 1: Exactly defective bulbs
First, calculate the binomial coefficient:
Then:
- Case 2: At most 2 defective bulbs )
This includes , , and :
Calculate each:
- ,
- ,
- .
Add them together:
- Case 3: At least 4 defective bulbs
This includes , , ..., :
We already calculated :
Then:
Graph: Binomial Distribution
Let me now plot the probabilities for for .
It seems there was a technical issue with the execution. Let me quickly recreate the graph for you and continue the explanation.
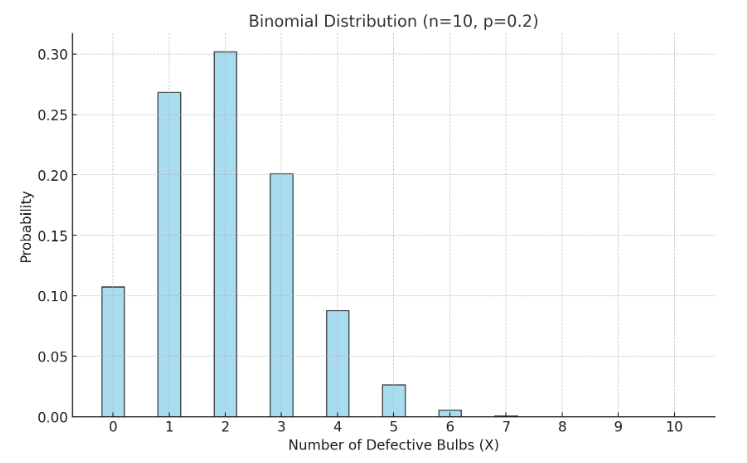
Here is the Binomial Distribution graph for trials and probability of success
Explanation of the Graph:
- The x-axis represents the number of defective bulbs , ranging from to .
- The y-axis shows the probability for each outcome.
- Each bar height corresponds to the probability of a particular value of :
- For , , which is the highest probability.
- Probabilities decrease as moves away from , reflecting the shape of the distribution.
Key Points:
- The graph is right-skewed because (low probability of success).
- is the most likely outcome, as indicated by the tallest bar.
Let me know if you'd like further clarifications or additional examples!
4. Why Choose Our Binomial Distribution Calculator?
Our calculator page provides a user-friendly interface that makes it accessible to both students and professionals. You can quickly input your square matrix and obtain the matrix of minors within a fraction of a second.
Our calculator saves you valuable time and effort. You no longer need to manually calculate each cofactor, making complex matrix operations more efficient.
Our calculator ensures accurate results by performing calculations based on established mathematical formulas and algorithms. It eliminates the possibility of human error associated with manual calculations.
Our calculator can handle all input values like integers, fractions, or any real number.
Alongside this calculator, our website offers additional calculators related to Pre-algebra, Algebra, Precalculus, Calculus, Coordinate geometry, Linear algebra, Chemistry, Physics, and various algebraic operations. These calculators can further enhance your understanding and proficiency.
5. A video based on how to Evaluate the Binomial Distribution.
6. How to use this calculator?
Using the Binomial Distribution Calculator is simple:
- Input Parameters: Enter , , , and specify if you need cumulative probabilities.
- Click Calculate: Instantly view the probability results.
- Analyze Outputs: Use the results to interpret your data or make decisions.
This calculator saves time, minimizes errors, and helps you focus on insights.
7. Solved Examples on Binomial Distribution
Example 1: Probability of Exact Successes
A coin is tossed times. What is the probability of getting exactly heads? Assume the coin is fair .
Solution:
-
Identify parameters:
- Number of trials ,
- Probability of success ,
- Number of successes .
-
Use the Binomial Formula:
Substituting values:
-
Calculate the binomial coefficient:
-
Calculate the probability:
Answer: The probability of getting exactly heads is .
Example 2: Tabular Data:
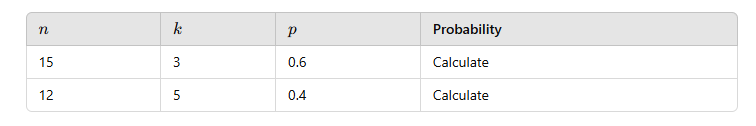
Steps:
-
Input each row into the calculator.
-
Compute probabilities for each scenario.
Our calculator simplifies these computations, providing results in seconds.
8. Frequently Asked Questions (FAQs)
Q1. What is the Binomial Distribution?
It models the probability of a fixed number of successes in a fixed number of independent trials, given a constant success probability.
Q2. What is in the formula?
is the probability of success in a single trial.
Q3. Is this calculator free?
Yes, our Binomial Distribution Calculator is completely free to use.
Q4. Does it support large datasets?
Yes, it can handle extensive tabular data efficiently.
Q5. Can I calculate cumulative probabilities?
Yes, the calculator provides both individual and cumulative probabilities.
Q6. Is it mobile-friendly?
Absolutely, it works seamlessly on any device.
Q7. Does the calculator show intermediate steps?
Yes, detailed steps are provided for better understanding.
Q8. Can I export the results?
Yes, you can download the outputs for further analysis.
9. What are the real-life applications?
The Binomial Distribution is widely used in:
- Market Research: Analyze survey responses.
- Manufacturing: Assess product defect rates.
- Healthcare: Model success rates in clinical trials.
- Education: Evaluate test question correctness.
- Finance: Analyze probabilities of specific market outcomes.
Fictional Anecdote: Emma, a quality control manager, uses our Binomial Distribution Calculator to predict defect rates in production batches. With accurate insights, she reduces defects by 15%, boosting customer satisfaction.
10. Conclusion
The Binomial Distribution Calculator is an essential tool for anyone working with probability and statistics. It simplifies complex calculations, provides accurate results, and is versatile enough for a wide range of applications.
Ready to analyze your data with confidence? Try our Binomial Distribution Calculator today and unlock the power of probability!
If you have any suggestions regarding the improvement of the content of this page, please write to me at My Official Email Address: doubt@doubtlet.com
Are you Stuck on homework, assignments, projects, quizzes, labs, midterms, or exams?
To get connected to our tutors in real time. Sign up and get registered with us.
Box and Whisker Plot Calculator
Z Score Calculator
Exponential Distribution Calculator
Geometric Distribution Calculator
Margin of Error Calculator
Decimal to Percent calculator
Percent to Decimal calculator