


Box and Whisker Plot Calculator
This calculator will help you to box and create a whisker plot for the given set of values with steps shown.Related Calculators:Five Number Summary Calculator

Neetesh Kumar | January 09, 2025
Share this Page on:
![]()
![]()
![]()
![]()
![]()
- 1. Introduction to the Box and Whisker Plot Calculator
- 2. What is the Formulae used
- 3. How do I find the Box and Whisker Plot?
- 4. Why choose our Box and Whisker Plot Calculator?
- 5. A Video for explaining this concept
- 6. How to use this calculator?
- 7. Solved Examples on Box and Whisker Plot
- 8. Frequently Asked Questions (FAQs)
- 9. What are the real-life applications?
- 10. Conclusion
Data visualization is essential for understanding and analyzing trends, outliers, and the distribution of data. The Box and Whisker Plot Calculator for a Table simplifies this process, providing a quick and accurate way to generate boxplots for your dataset. Whether you’re a student, researcher, or analyst, this tool helps you present data in a clear and concise manner.
1. Introduction to the Box and Whisker Plot Calculator
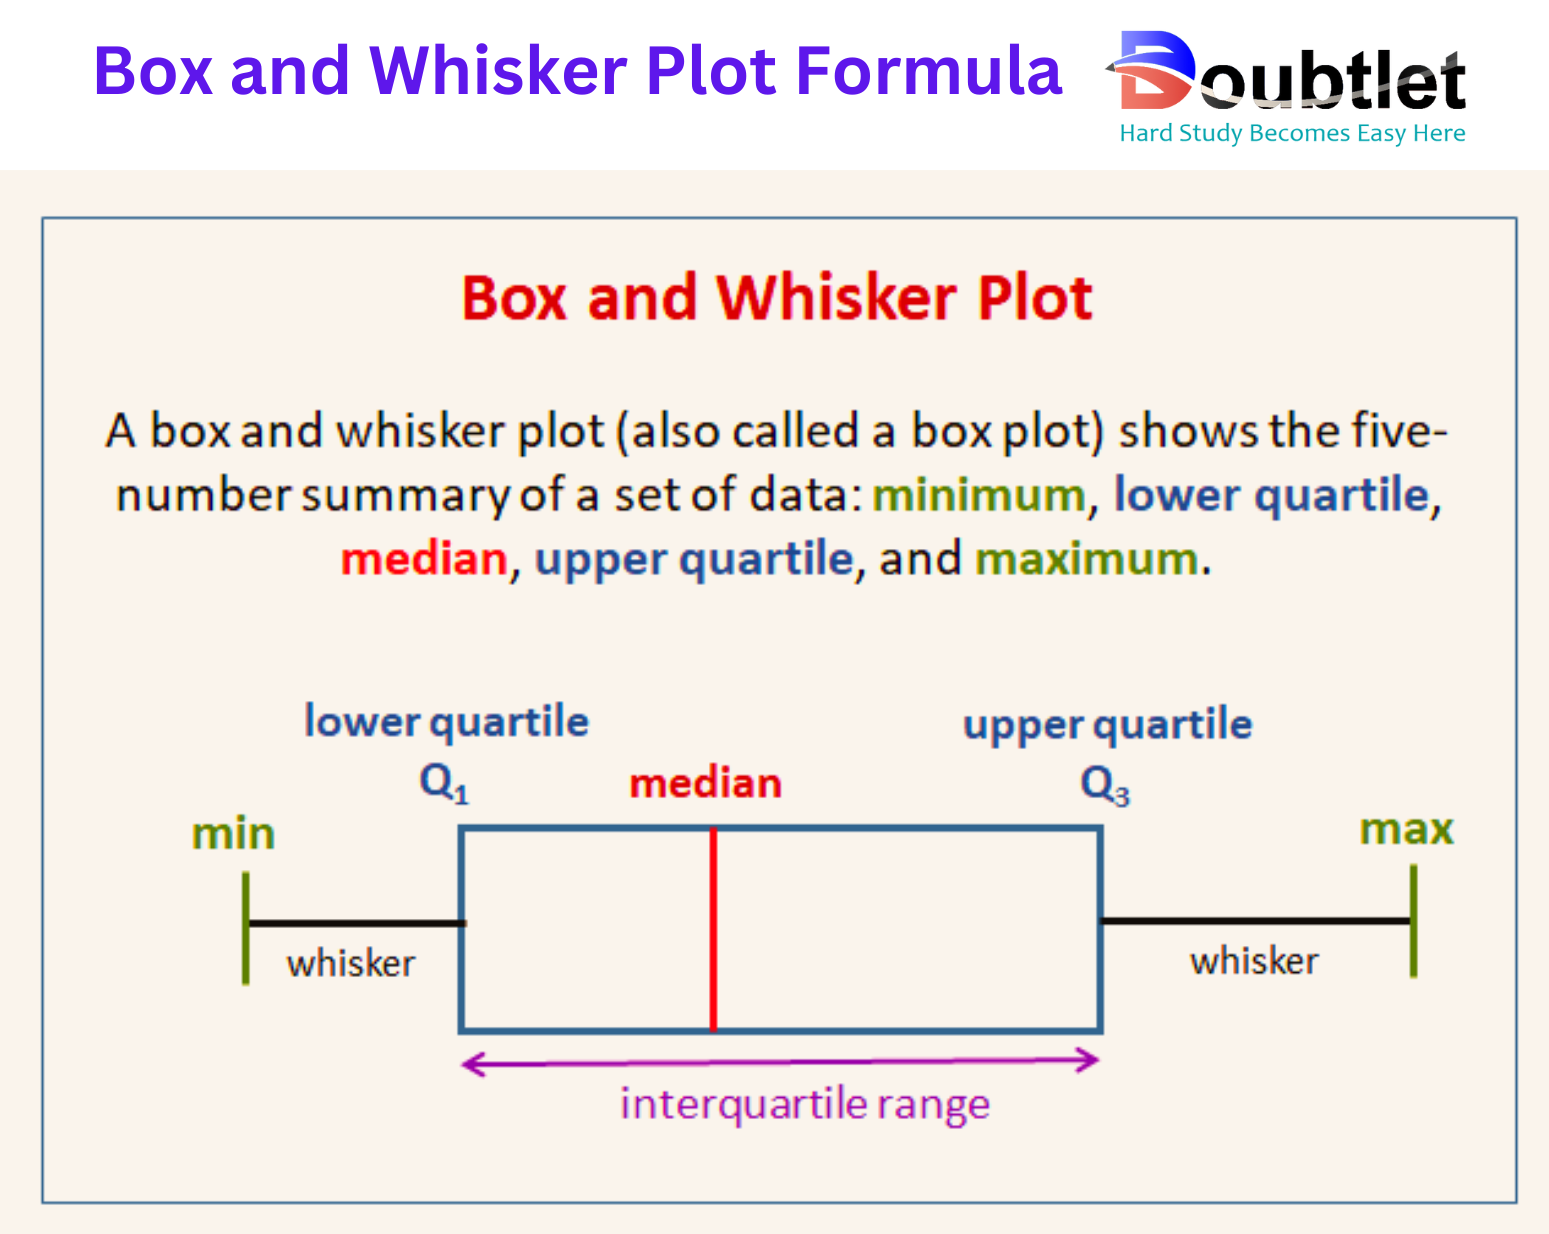
A Box and Whisker Plot, also known as a boxplot, is a graphical representation of a dataset’s five-number summary: minimum, first quartile (), median, third quartile (), and maximum. It highlights the spread, central tendency, and potential outliers in your data.
Our Box and Whisker Plot Calculator is designed for tabular data, making it easy to analyze multiple datasets and create clear visualizations in seconds. From summarizing test scores to examining financial trends, this tool is a must-have for data visualization.
2. What is the Formulae used?
The Box and Whisker Plot is based on the five-number summary:
- Minimum: The smallest data point.
- First Quartile (): The median of the lower half of the dataset.
- Median: The middle value when the data is ordered.
- Third Quartile (): The median of the upper half of the dataset.
- Maximum: The largest data point.
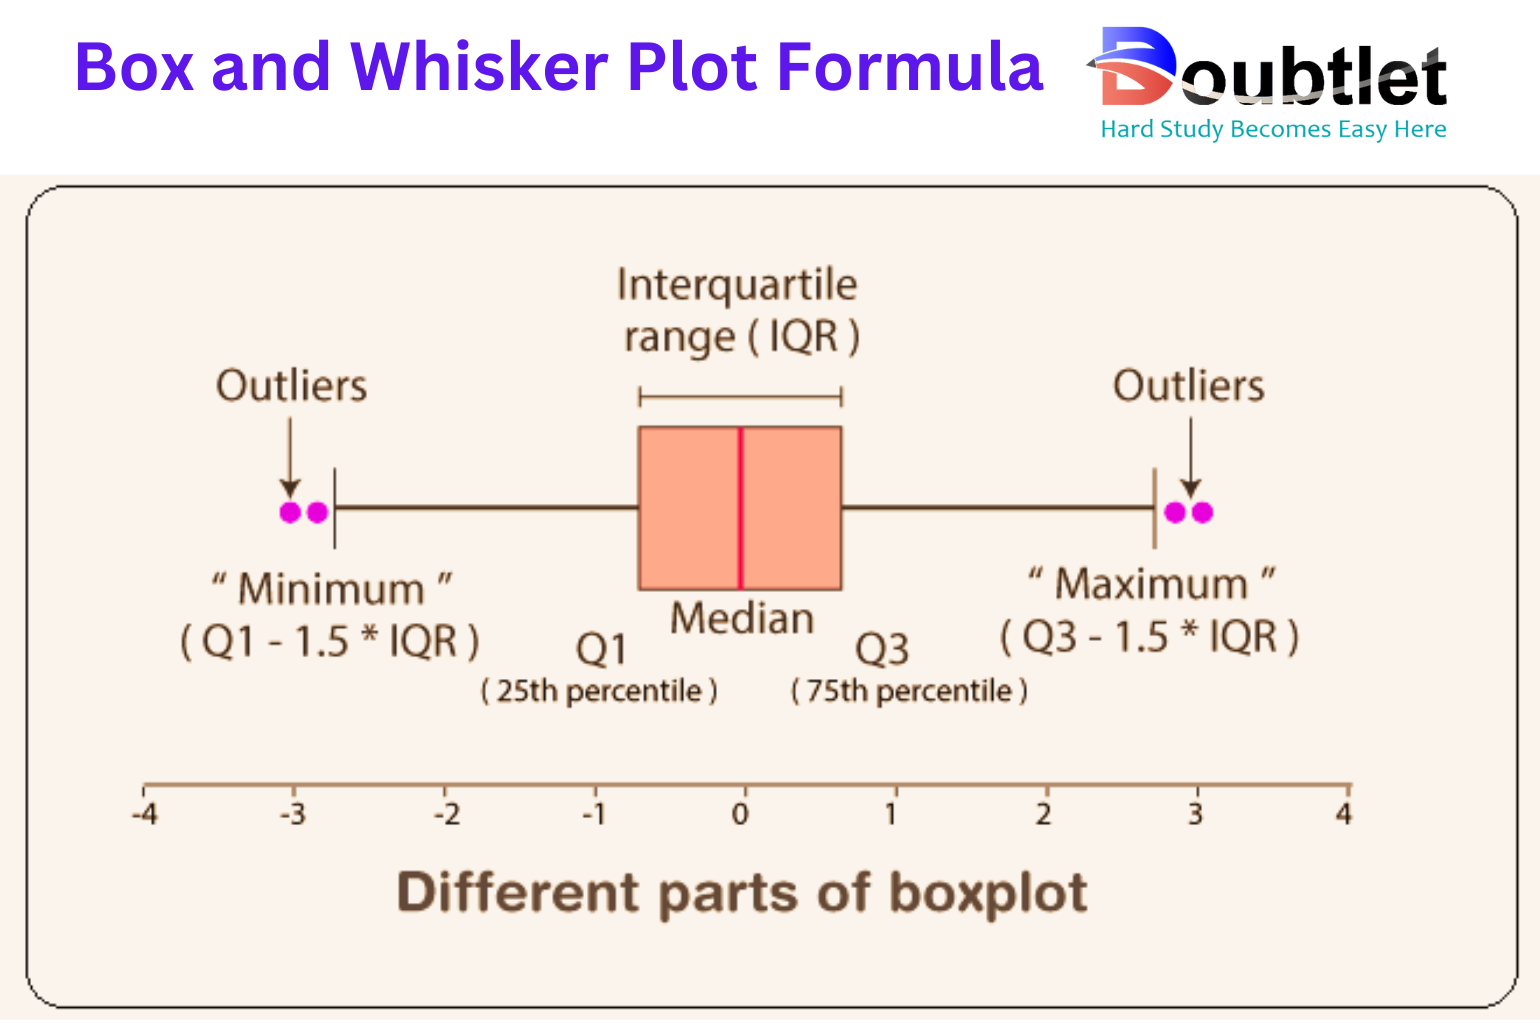
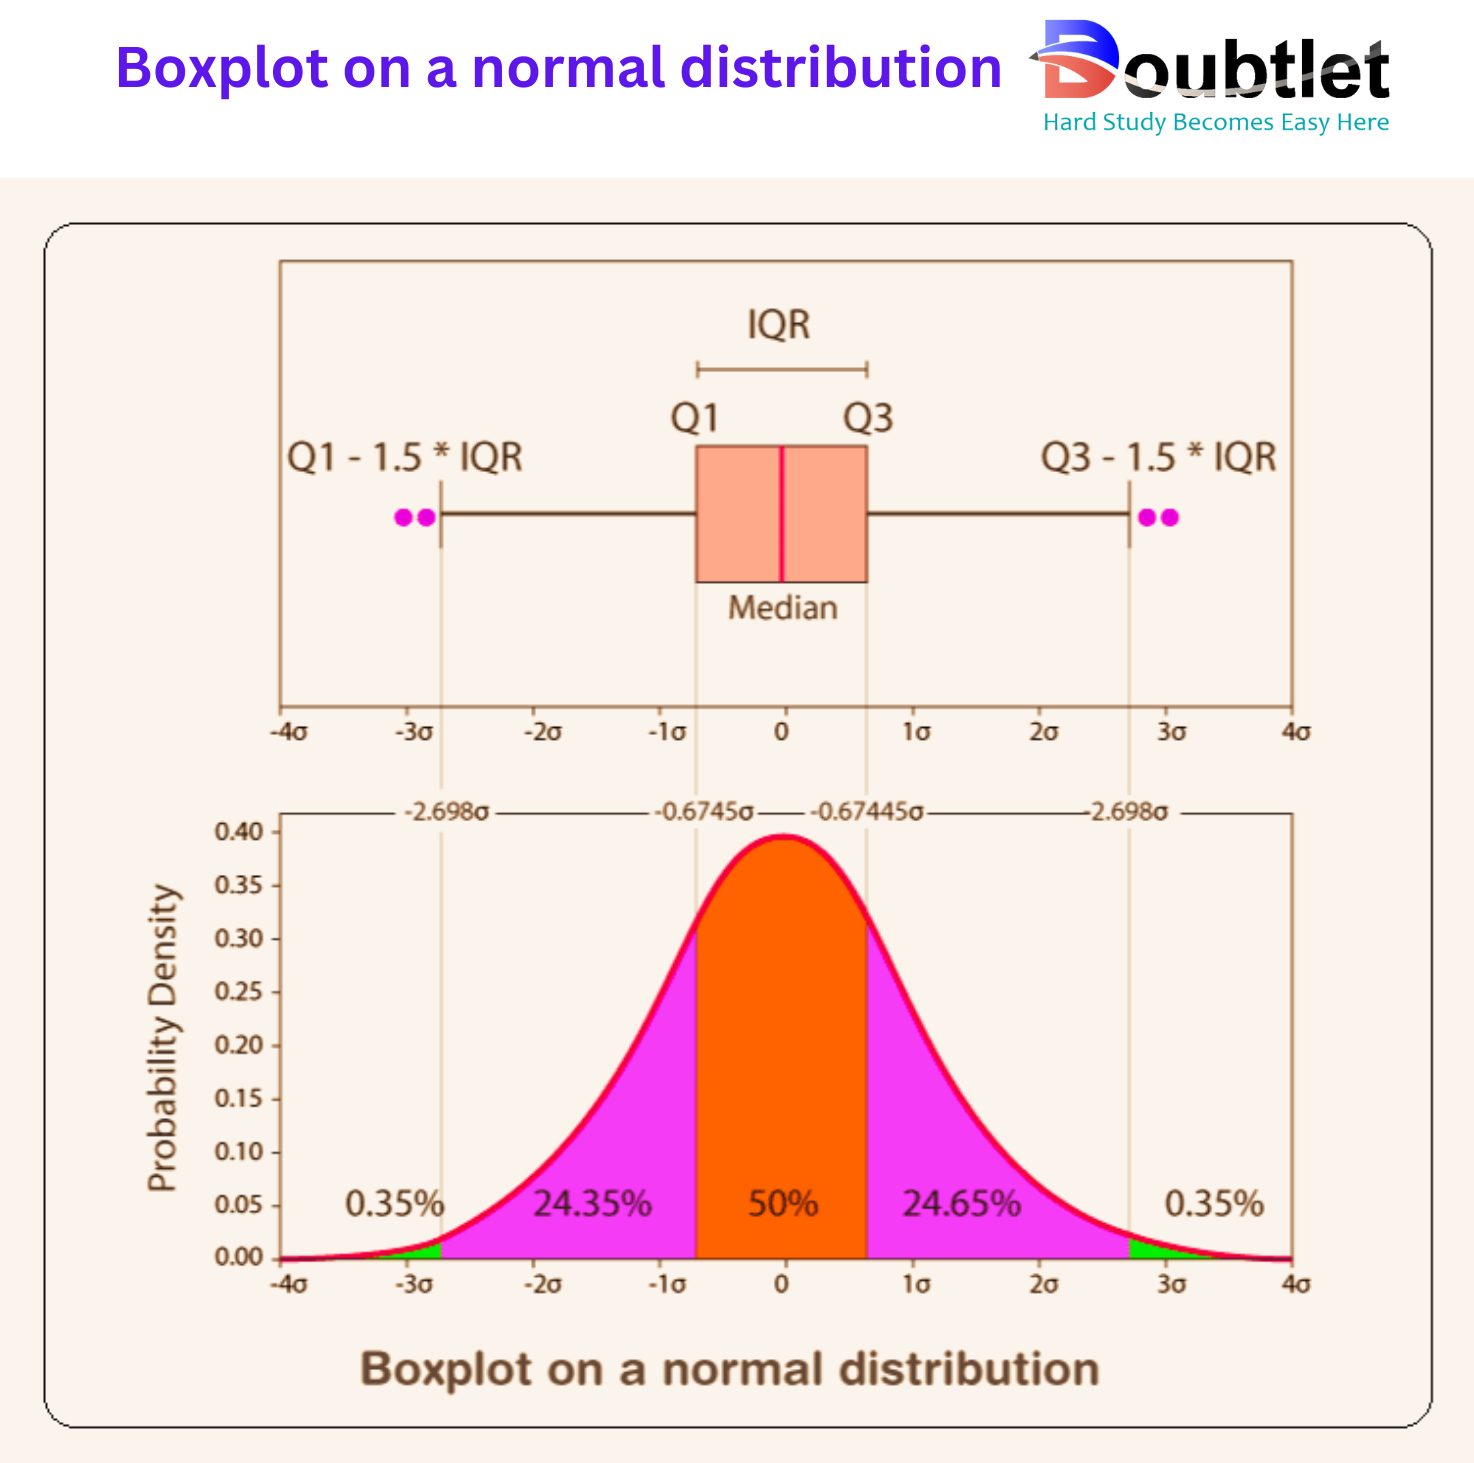
To identify outliers:
-
Interquartile Range (IQR):
-
Lower Fence:
-
Upper Fence:
Data points outside the fences are considered outliers.
3. How Do I Find the Box and Whisker Plot?
To manually create a box and whisker plot:
- Order the Data: Arrange data points in ascending order.
- Calculate the Five-Number Summary: Find the minimum, , median, , and maximum.
- Determine Outliers: Compute the IQR and identify values outside the lower and upper fences.
- Draw the Plot: Use the five-number summary to create the box and whiskers, marking any outliers separately.
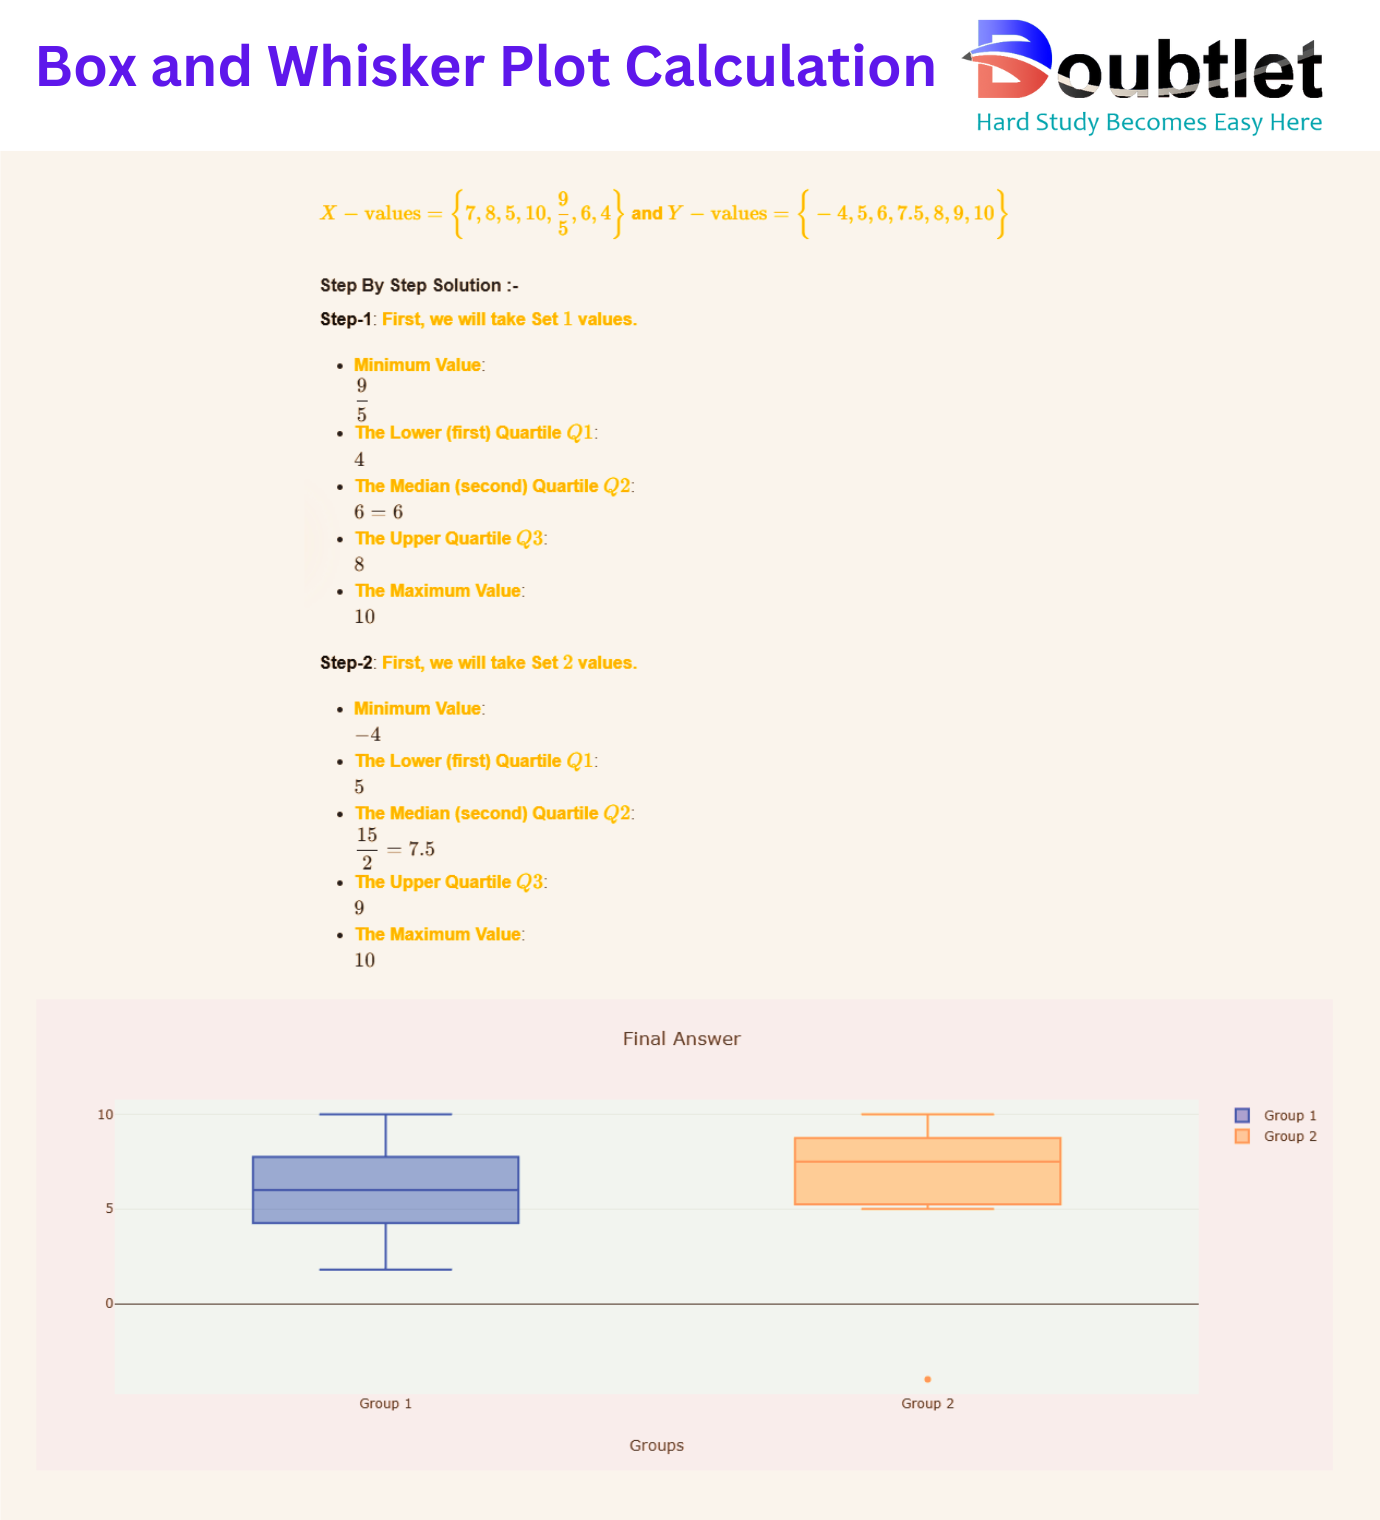
Example:
Dataset:
- Ordered Data:
- Five-Number Summary:
- Minimum:
- :
- Median:
- :
- Maximum:
- IQR:
- Lower Fence:
- Upper Fence:
This dataset has no outliers, and the boxplot would reflect this.
For large datasets, manual calculations can be tedious, but our calculator generates the plot effortlessly.
4. Why Choose Our Box and Whisker Plot Calculator?
Our calculator page provides a user-friendly interface that makes it accessible to both students and professionals. You can quickly input your square matrix and obtain the matrix of minors within a fraction of a second.
Our calculator saves you valuable time and effort. You no longer need to manually calculate each cofactor, making complex matrix operations more efficient.
Our calculator ensures accurate results by performing calculations based on established mathematical formulas and algorithms. It eliminates the possibility of human error associated with manual calculations.
Our calculator can handle all input values like integers, fractions, or any real number.
Alongside this calculator, our website offers additional calculators related to Pre-algebra, Algebra, Precalculus, Calculus, Coordinate geometry, Linear algebra, Chemistry, Physics, and various algebraic operations. These calculators can further enhance your understanding and proficiency.
5. A video based on how to Evaluate the Box and Whisker Plot.
6. How to use this calculator?
Using the Box and Whisker Plot Calculator is straightforward:
- Input Data: Enter your dataset or upload a table.
- Click Calculate: Instantly generate the five-number summary and the boxplot.
- Analyze Results: Review the visualization and identify trends, outliers, or anomalies.
This tool saves time and ensures accuracy, allowing you to focus on insights.
7. Solved Examples on Box and Whisker Plot
Example 1:
Dataset:
Solution:
- Ordered Data:
- Five-Number Summary:
- Minimum:
- :
- Median:
- :
- Maximum:
- IQR:
- No outliers detected.
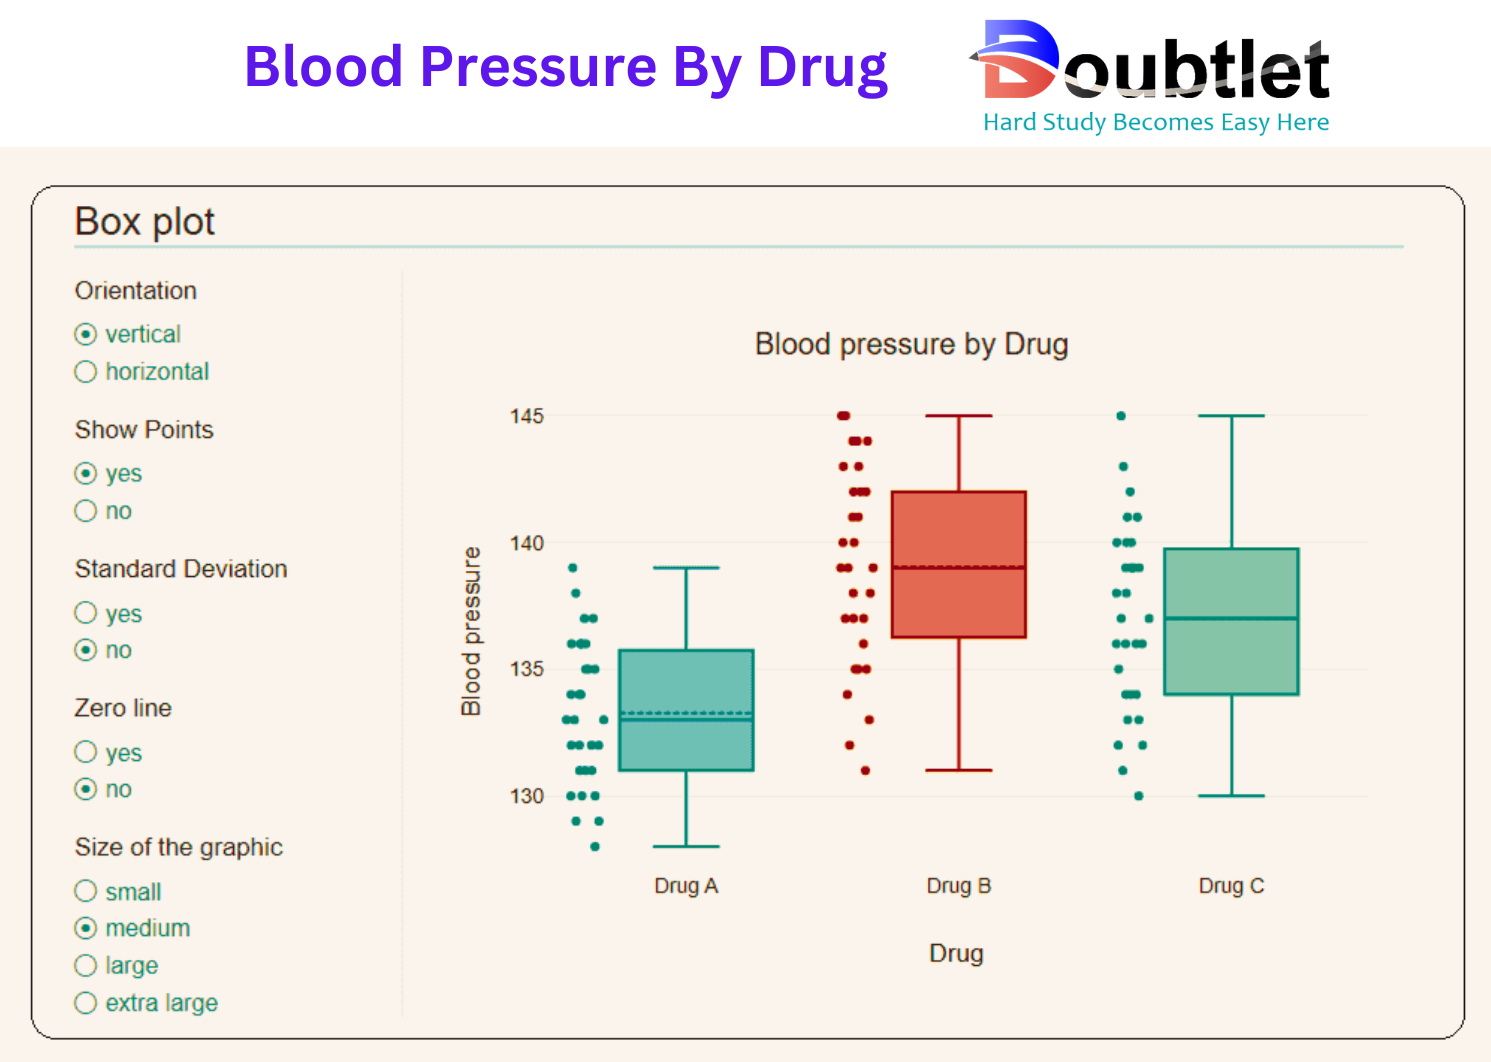
Example 2: Tabular Data:
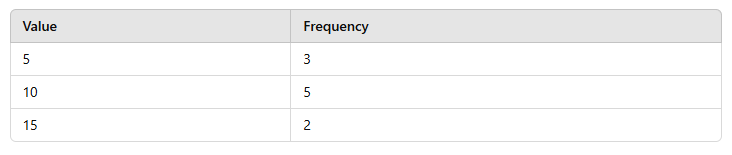
Steps:
- Expand data based on frequency.
- Calculate five-number summary and IQR.
- Generate boxplot.
Our calculator handles these steps effortlessly, providing clear visualizations in seconds.
8. Frequently Asked Questions (FAQs)
Q1. What is a box and whisker plot?
It’s a graphical representation of a dataset’s five-number summary, showing spread, central tendency, and outliers.
Q2. What is the IQR?
The interquartile range (IQR) is the difference between and , measuring data spread.
Q3. Is this calculator free?
Yes, our Box and Whisker Plot Calculator is completely free.
Q4. Can I use it for grouped data?
Yes, the calculator supports grouped data and tabular inputs.
Q5. Does it identify outliers?
Yes, it calculates fences and highlights outliers in the plot.
Q6. Is it mobile-friendly?
Absolutely, it works seamlessly on all devices.
Q7. Can I export the boxplot?
Yes, you can download the visualization for presentations or reports.
Q8. Does it show intermediate calculations?
Yes, the calculator provides detailed steps for transparency.
9. What are the real-life applications?
Box and whisker plots are widely used across various fields:
- Education: Compare student performance in exams.
- Finance: Visualize stock price distributions.
- Healthcare: Analyze patient health metrics like blood pressure.
- Manufacturing: Monitor product quality and detect defects.
- Market Research: Summarize survey responses and consumer behavior.
Fictional Anecdote: Sarah, a data analyst, uses our Box and Whisker Plot Calculator to visualize customer satisfaction scores. By identifying outliers, she pinpoints areas for improvement, boosting customer retention by .
10. Conclusion
The Box and Whisker Plot Calculator is a powerful tool for data visualization and analysis. It simplifies complex calculations, identifies trends, and highlights outliers, making it invaluable for professionals, researchers, and students.
Ready to transform your data into actionable insights? Try our Box and Whisker Plot Calculator today and see the difference!
If you have any suggestions regarding the improvement of the content of this page, please write to me at My Official Email Address: doubt@doubtlet.com
Are you Stuck on homework, assignments, projects, quizzes, labs, midterms, or exams?
To get connected to our tutors in real time. Sign up and get registered with us.
Poisson Distribution Calculator
P Value Calculator
Z Score Calculator
Binomial Distribution Calculator
Exponential Distribution Calculator
Geometric Distribution Calculator
Margin of Error Calculator