


Exponential Distribution Calculator
This calculator will help you to obtain the exponential distribution with steps for given values of lambda and random variable X.Related Calculators:Geometric Distribution Calculator
Loading...
Loading...

Neetesh Kumar | January 11, 2025
Share this Page on:
![]()
![]()
![]()
![]()
![]()
- 1. Introduction to the Exponential Distribution Calculator
- 2. What is the Formulae used
- 3. How Do I Find the Exponential Distribution?
- 4. Why Choose Our Exponential Distribution Calculator?
- 5. A Video for explaining this concept
- 6. How to use this calculator?
- 7. Solved Examples on Exponential Distribution
- 8. Frequently Asked Questions (FAQs)
- 9. What are the real-life applications?
- 10. Conclusion
The Exponential Distribution is a fundamental concept in probability, widely used for modeling the time until an event occurs, such as system failures, arrival times, or waiting periods. The Exponential Distribution Calculator for a Table is a powerful tool that automates these calculations, saving time and providing accurate results. Whether you’re a student, researcher, or data analyst, this calculator is indispensable for analyzing real-world scenarios.
1. Introduction to the Exponential Distribution Calculator
The Exponential Distribution models the probability of time between events in a Poisson process, where events occur continuously and independently at a constant rate. It’s characterized by its simplicity and applicability in real-world scenarios, such as predicting machine lifespans or customer arrivals.
Our Exponential Distribution Calculator is optimized for tabular data, enabling you to calculate probabilities, cumulative probabilities, and expected values effortlessly. Whether working on reliability analysis or service optimization, this tool is your go-to resource.
2. What is the Formulae used?
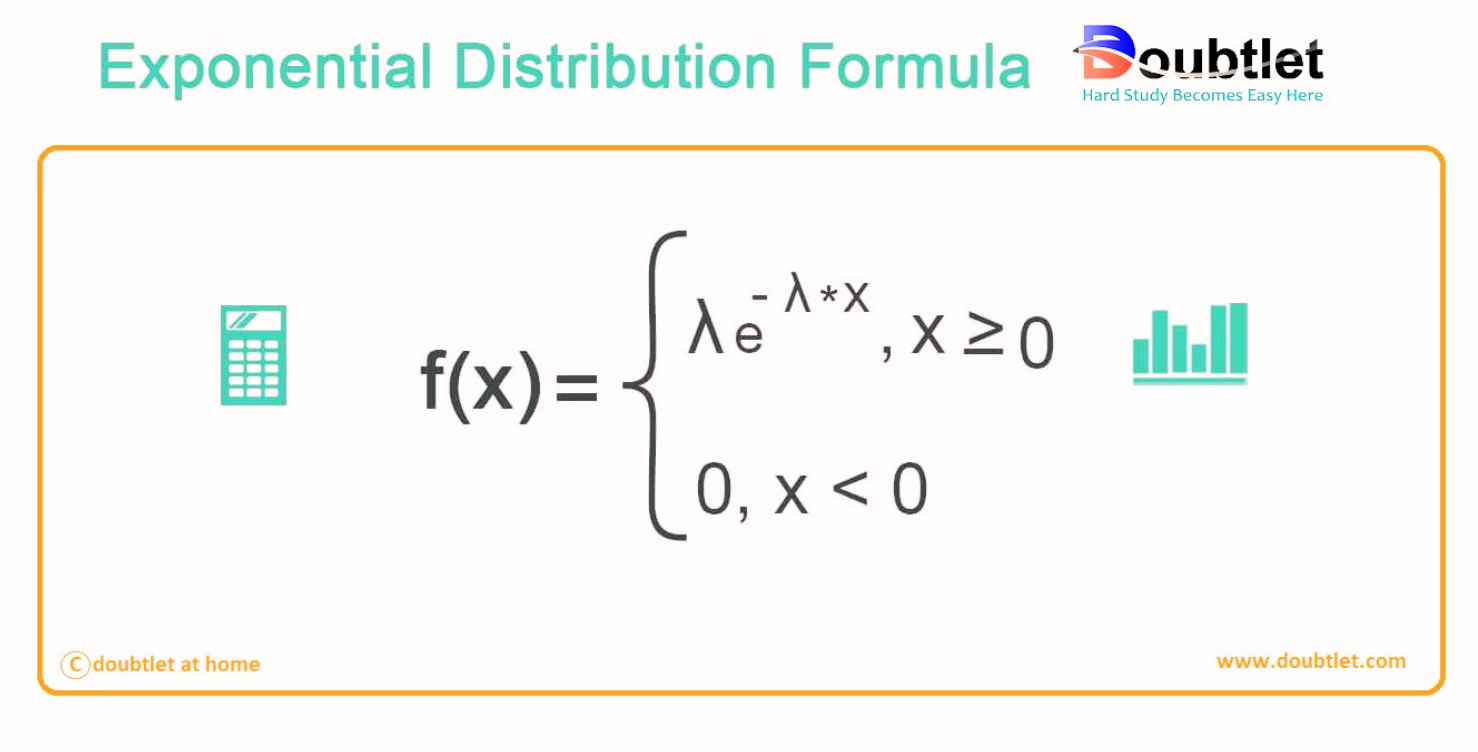
The Probability Density Function (PDF) for the Exponential Distribution is:
Where:
- : Time or value for which the probability is calculated.
- : Rate parameter (events per unit time).
The Cumulative Distribution Function (CDF) is:
Mean:
Variance:
These formulas allow you to compute probabilities and statistical measures like mean and variance for the Exponential Distribution.
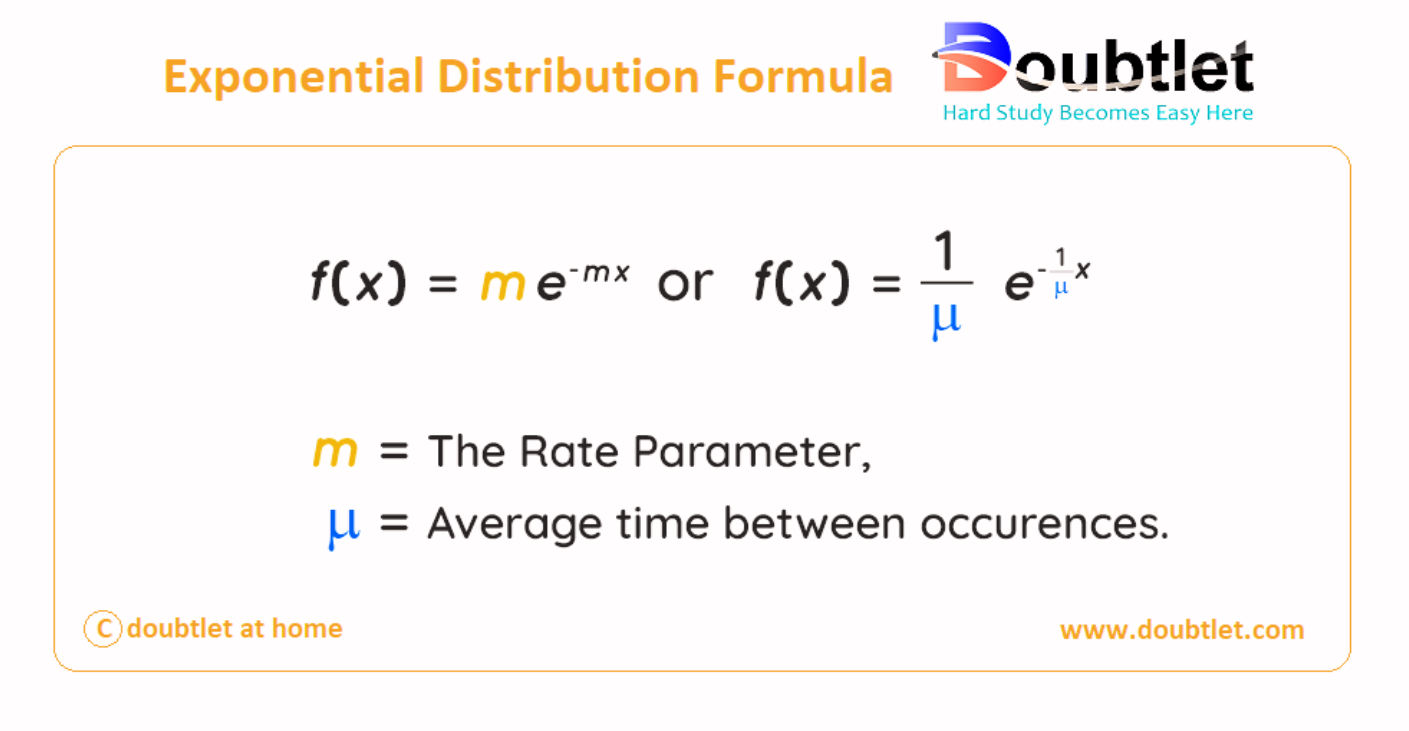
What is the Exponential Distribution Formula?
The exponential distribution formula is used to define the exponential distribution. For an exponential distribution, the variable must be continuous and independent. The formula is given by:
or
Where:
- : The rate parameter or decay parameter.
- : The average time between occurrences.
What is Exponential Distribution?
The exponential distribution is a continuous probability distribution that times the occurrence of events. These events are independent and occur at a steady average rate. In other words, it is used to model the time a person needs to wait before the given event happens.
It is a continuous counterpart of a geometric distribution. It is a memoryless random distribution comprising many small values and less large values. It is different from the Poisson distribution - Poisson predicts the number of times an event transpires in a given period and not the time gap.
3. How Do I Find the Exponential Distribution?
Calculating Probabilities Manually
- Identify Parameters: Determine (rate parameter) and .
- Use the PDF: Substitute and into the formula for .
- Use the CDF (if cumulative probability is needed): Substitute and into .
- Calculate Mean and Variance (if required): Use and formulas.
Example:
A system has a failure rate of failures per hour. What’s the probability the system lasts more than hours without failure?
- CDF for :
Manually solving for large datasets can be tedious, but our calculator simplifies these calculations.
Statistics - Exponential distribution
Exponential distribution or negative exponential distribution represents a probability distribution to describe the time between events in a Poisson process. In Poisson process events occur continuously and independently at a constant average rate. Exponential distribution is a particular case of the gamma distribution.
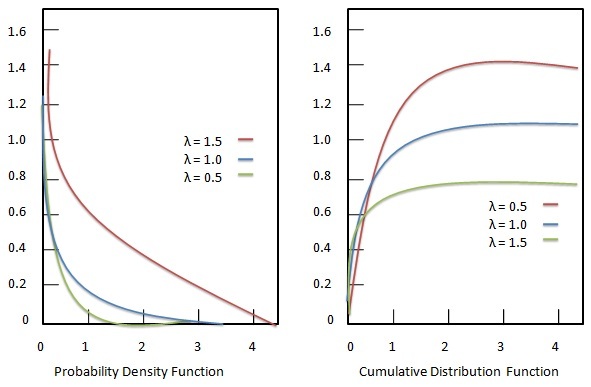
Exponential Distribution Graph
The exponential distribution graph represents the probability density function, illustrating the distribution of distance or time taken between events. The two terms used in the graph are:
- : Represents the events per unit time.
- : Represents the time.
The following graph typically shows the values for and .
Exponential Distribution Overview:
The probability density function (PDF) of the Exponential Distribution is:
Where:
- is the rate parameter (mean time between events is ).
- is the random variable (time between events).
The cumulative distribution function (CDF) is:
Example 1: Time Between Events
The average time between arrivals at a store is minutes.
Find:
- The probability that the next arrival occurs within minutes.
- The probability that the next arrival takes more than minutes.
Solution:
-
Given:
- Mean time = minutes, so .
-
Probability within minutes :
Use the CDF:
Substituting values:
So,
-
Probability taking more than minutes :
Use the complement rule:
Substituting values:
Answer:
Example 2: Mean Time Between Failures
The lifetime of a machine component follows an exponential distribution with a mean of hours.
Find:
- The probability that the component lasts more than hours.
- The probability that the component fails within hours.
Solution:
-
Given:
- Mean time = hours, so .
-
Probability lasting more than hours :
Use the complement rule:
Substituting values:
-
Probability failing within 5 hours :
Use the CDF:
Substituting values:
Answer:
Graph Explanation:
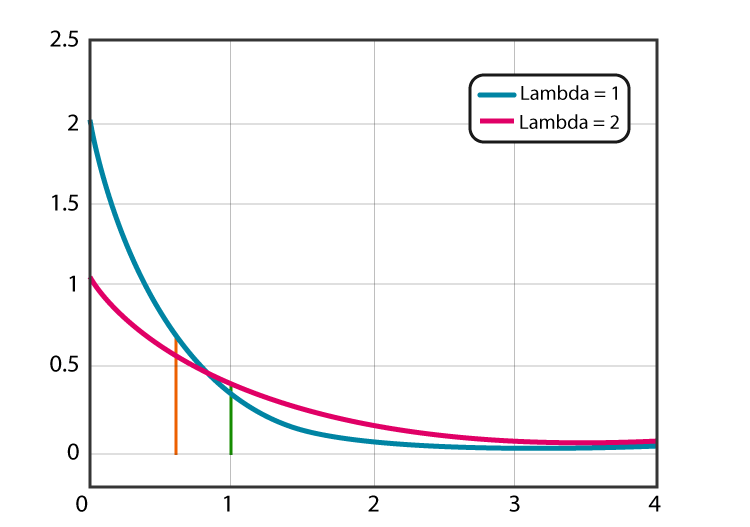
For an exponential distribution, the graph of the PDF is a decaying exponential curve, starting at with the maximum value of and decreasing as increases. Let’s visualize the distribution for a specific .
Let me plot an Exponential Distribution graph for and explain its shape.
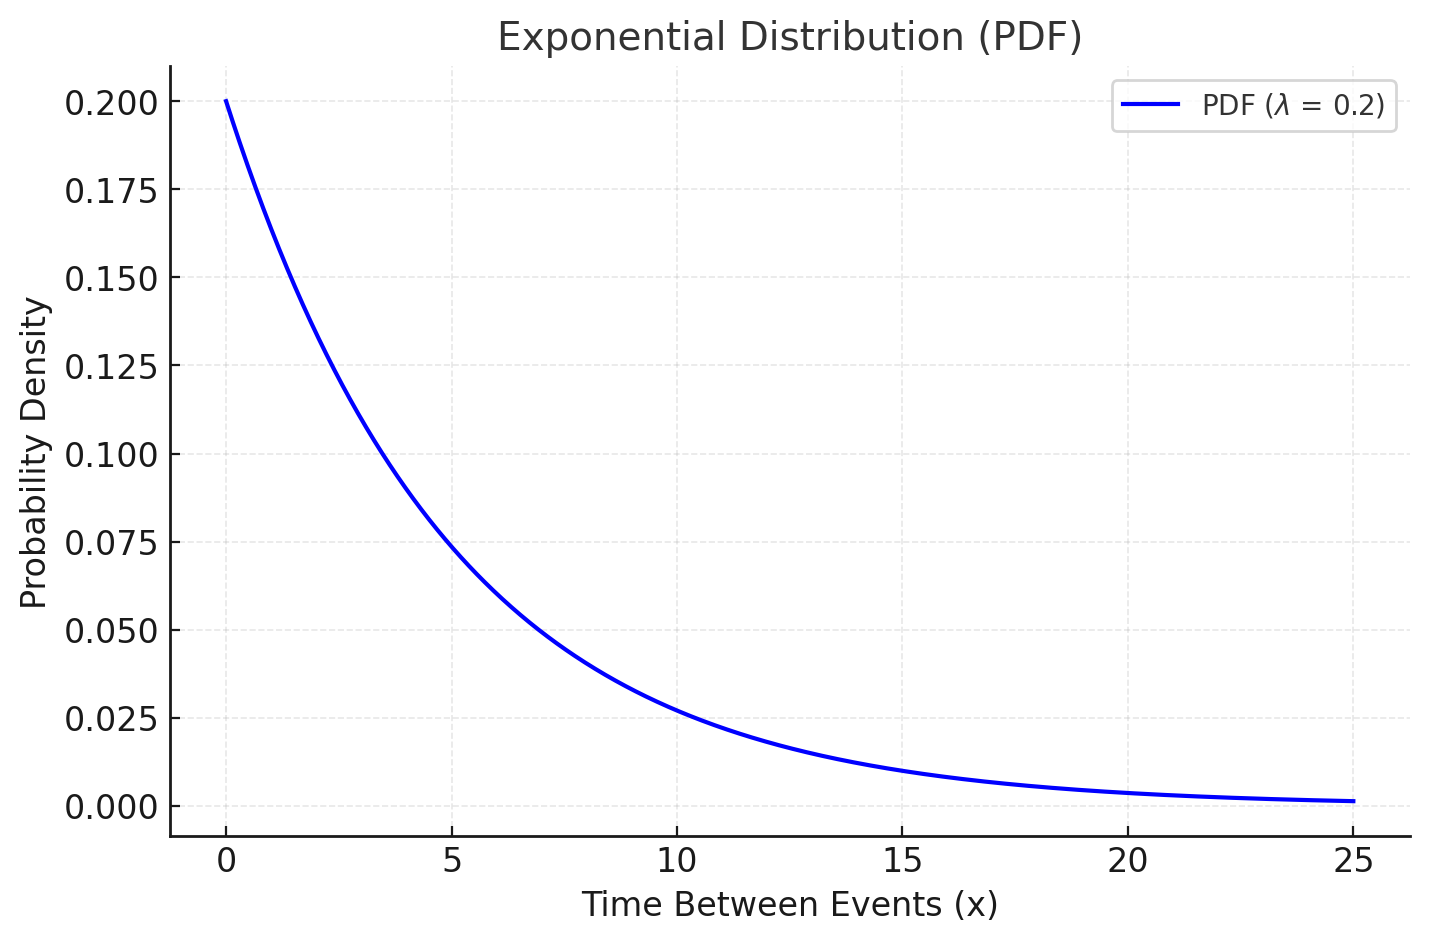
Explanation of the Exponential Distribution Graph:
- The x-axis represents the time between events .
- The y-axis represents the probability density function .
- The curve starts at its maximum value, , at and decreases exponentially as increases.
- This graph shows that shorter intervals between events (e.g., ) are more probable than longer intervals (e.g., ).
Let me know if you'd like further clarification or additional examples!
4. Why Choose Our Exponential Distribution Calculator?
Our calculator page provides a user-friendly interface that makes it accessible to both students and professionals. You can quickly input your square matrix and obtain the matrix of minors within a fraction of a second.
Our calculator saves you valuable time and effort. You no longer need to manually calculate each cofactor, making complex matrix operations more efficient.
Our calculator ensures accurate results by performing calculations based on established mathematical formulas and algorithms. It eliminates the possibility of human error associated with manual calculations.
Our calculator can handle all input values like integers, fractions, or any real number.
Alongside this calculator, our website offers additional calculators related to Pre-algebra, Algebra, Precalculus, Calculus, Coordinate geometry, Linear algebra, Chemistry, Physics, and various algebraic operations. These calculators can further enhance your understanding and proficiency.
5. A video based on how to Evaluate the Exponential Distribution.
6. How to use this calculator?
Using the Exponential Distribution Calculator is simple:
- Input Data: Enter the rate parameter and the time/value .
- Choose Output: Select PDF, CDF, mean, variance, or all.
- Click Calculate: Instantly view the results.
This calculator automates complex calculations, letting you focus on data interpretation.
7. Solved Examples on Exponential Distribution
Example 1:
A call center receives an average of calls per hour . What’s the probability of waiting more than minutes for the next call?
Solution:
-
CDF for :
Example 2: Tabular Data:
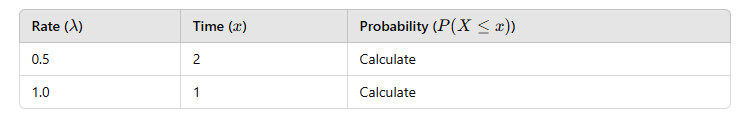
Steps:
-
Use the CDF formula for each row.
-
Compute probabilities for each combination of and .
Our calculator handles these computations quickly, even for extensive datasets.
8. Frequently Asked Questions (FAQs)
Q1. What is the Exponential Distribution?
It’s a probability distribution that models the time between events in a Poisson process.
Q2. What is in the formula?
is the rate parameter, representing events per unit time.
Q3. Is this calculator free to use?
Yes, our Exponential Distribution Calculator is completely free.
Q4. Does it handle large datasets?
Yes, it’s optimized for extensive tabular data.
Q5. Can it calculate cumulative probabilities?
Yes, the calculator computes both PDF and CDF values.
Q6. Is it mobile-friendly?
Yes, it works seamlessly on all devices.
Q7. Does the tool provide intermediate steps?
Yes, detailed steps are shown for transparency.
Q8. Can I export results?
Yes, you can download the outputs for further analysis.
9. What are the real-life applications?
The Exponential Distribution is widely used across various fields:
- Reliability Engineering: Model lifespans of systems or components.
- Customer Service: Analyze waiting times between calls or customers.
- Healthcare: Estimate survival times or time between events.
- Telecommunications: Predict data packet arrival times.
- Traffic Flow Analysis: Model intervals between vehicle arrivals.
Fictional Anecdote: John, an operations manager, uses our Exponential Distribution Calculator to optimize service times in his call center. By identifying bottlenecks, he reduces customer wait times by 20%.
10. Conclusion
The Exponential Distribution Calculator is an essential tool for anyone working with probabilities and time-based events. It simplifies complex formulas, provides accurate results, and is versatile enough for a wide range of applications.
Ready to streamline your probability calculations? Try our Exponential Distribution Calculator today and uncover the power of precision!
If you have any suggestions regarding the improvement of the content of this page, please write to me at My Official Email Address: doubt@doubtlet.com
Are you Stuck on homework, assignments, projects, quizzes, labs, midterms, or exams?
To get connected to our tutors in real time. Sign up and get registered with us.
Z Score Calculator
Binomial Distribution Calculator
Geometric Distribution Calculator
Margin of Error Calculator
Decimal to Percent calculator
Percent to Decimal calculator
Percent to Fraction calculator