


Hypergeometric Distribution Calculator
This calculator will help you to obtain the hypergeometric distribution with steps for given input values.Related Calculators:Poisson Distribution Calculator

Neetesh Kumar | January 17, 2025
Share this Page on:
![]()
![]()
![]()
![]()
![]()
- 1. Introduction to the Hypergeometric Distribution Calculator
- 2. What is the Formulae used
- 3. How do I find the Hypergeometric Distribution?
- 4. Why choose our Hypergeometric Distribution Calculator?
- 5. A Video for explaining this concept
- 6. How to use this calculator?
- 7. Solved Examples on Hypergeometric Distribution
- 8. Frequently Asked Questions (FAQs)
- 9. What are the real-life applications?
- 10. Conclusion
The Hypergeometric Distribution is essential for probability problems where sampling is performed without replacement. The Hypergeometric Distribution Calculator for a Table helps simplify these calculations, making it easy to determine probabilities accurately and efficiently. Whether you're a student, researcher, or data analyst, this tool is invaluable for analyzing real-world scenarios involving finite populations.
1. Introduction to the Hypergeometric Distribution Calculator
The Hypergeometric Distribution models the probability of selecting a certain number of successes in a sample drawn from a population, where the population contains both successes and failures, and the sampling is without replacement.
Our Hypergeometric Distribution Calculator is optimized for tabular data, allowing you to compute multiple probabilities simultaneously. It’s ideal for applications in statistics, genetics, quality control, and more.
2. What is the Formulae used?
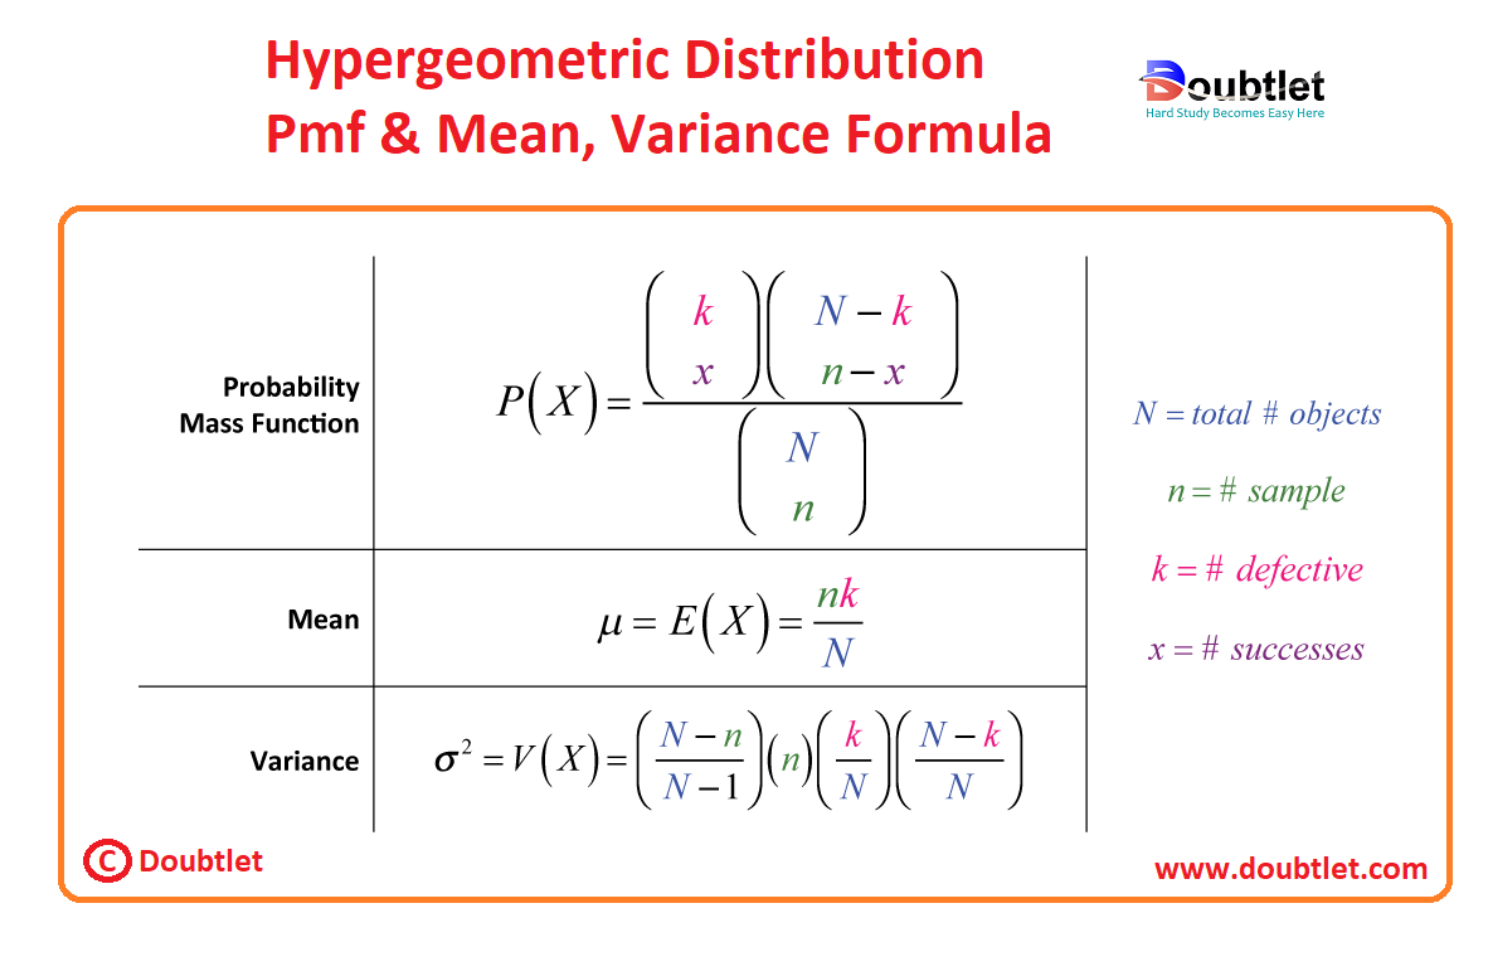
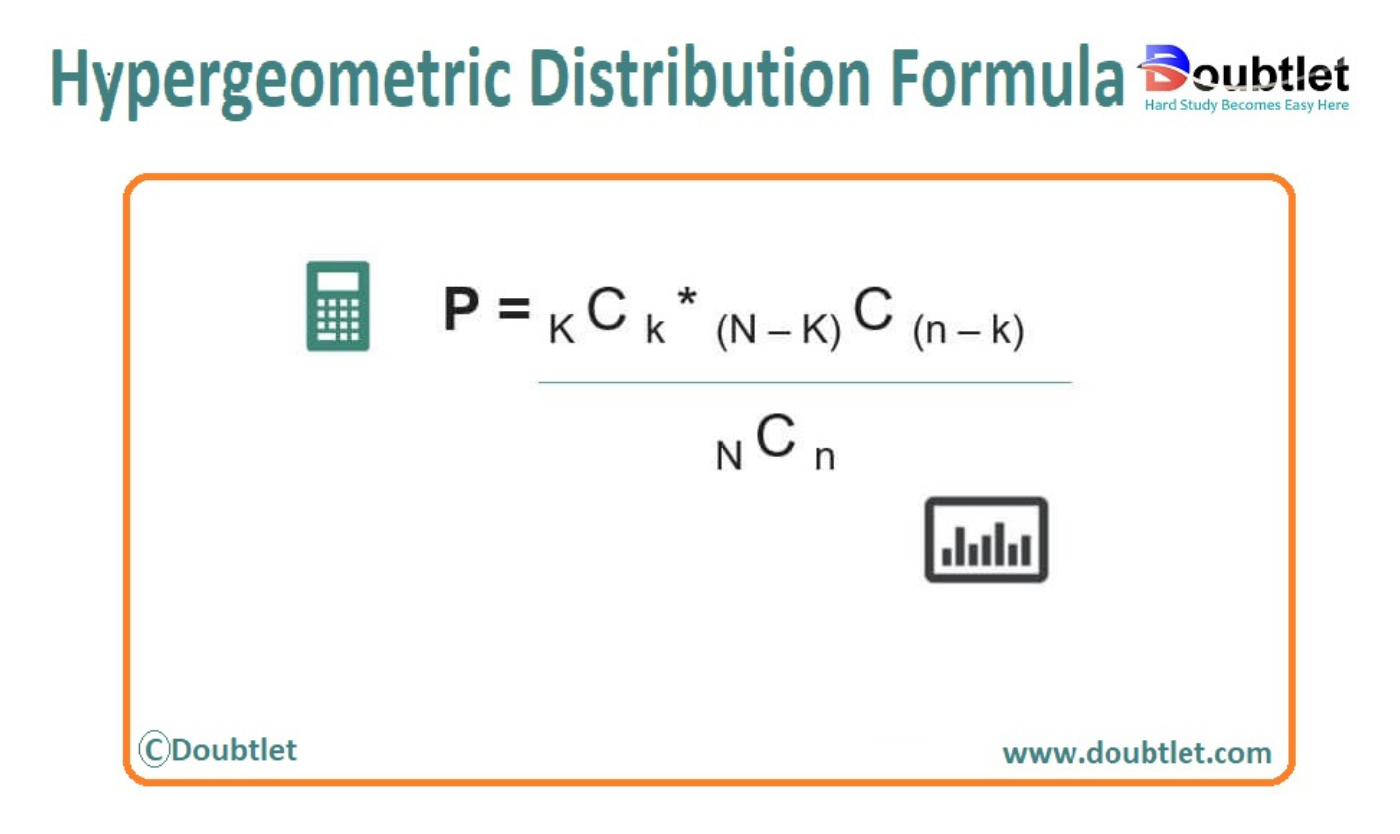
The probability mass function (PMF) for the Hypergeometric Distribution is:
Where:
-
: Probability of selecting exactly successes.
-
: Total population size.
-
: Total number of successes in the population.
-
: Sample size.
-
: Number of successes in the sample.
-
: Binomial coefficient, representing combinations:
This formula allows you to calculate the probability of specific outcomes in finite populations.
Formulas
Suppose a set of N objects contains k objects that are classified as successes and N-k objects that are classified as failures, then with a sample size of n randomly selected objects, without replacement. In that case, the Hypergeometric random variable X has the following properties as noted by Penn State.
Now I know these formulas look intimidating but trust me when I tell you that they’re easy to use and understand when you see them in action.
What Is Hypergeometric Distribution?
Hypergeometric distribution is a distinct probability distribution that defines the k successes probability (some random draws for the object drawn that has some specified feature) in n no of draws, without any replacement, from a given population size N that includes accurately K objects having that feature, where the draw may succeed or may fail.
The probability of a hypergeometric distribution is derived using the number of items in the population, number of items in the sample, number of successes in the population, number of successes in the sample, and few combinations.
3. How Do I Find the Hypergeometric Distribution?
To calculate the probability manually:
-
Identify Parameters: Determine , , , and .
-
Compute Combinations: Use the binomial coefficient formula to calculate , , and .
-
Apply the Formula: Substitute the values into the PMF.
Example: A box contains red balls and blue balls (, ). What is the probability of drawing red balls in a sample of (, )?
Steps:
-
Compute .
-
Compute .
-
Compute .
-
Probability:
Manually performing these calculations for large datasets can be tedious, but our calculator simplifies the process.
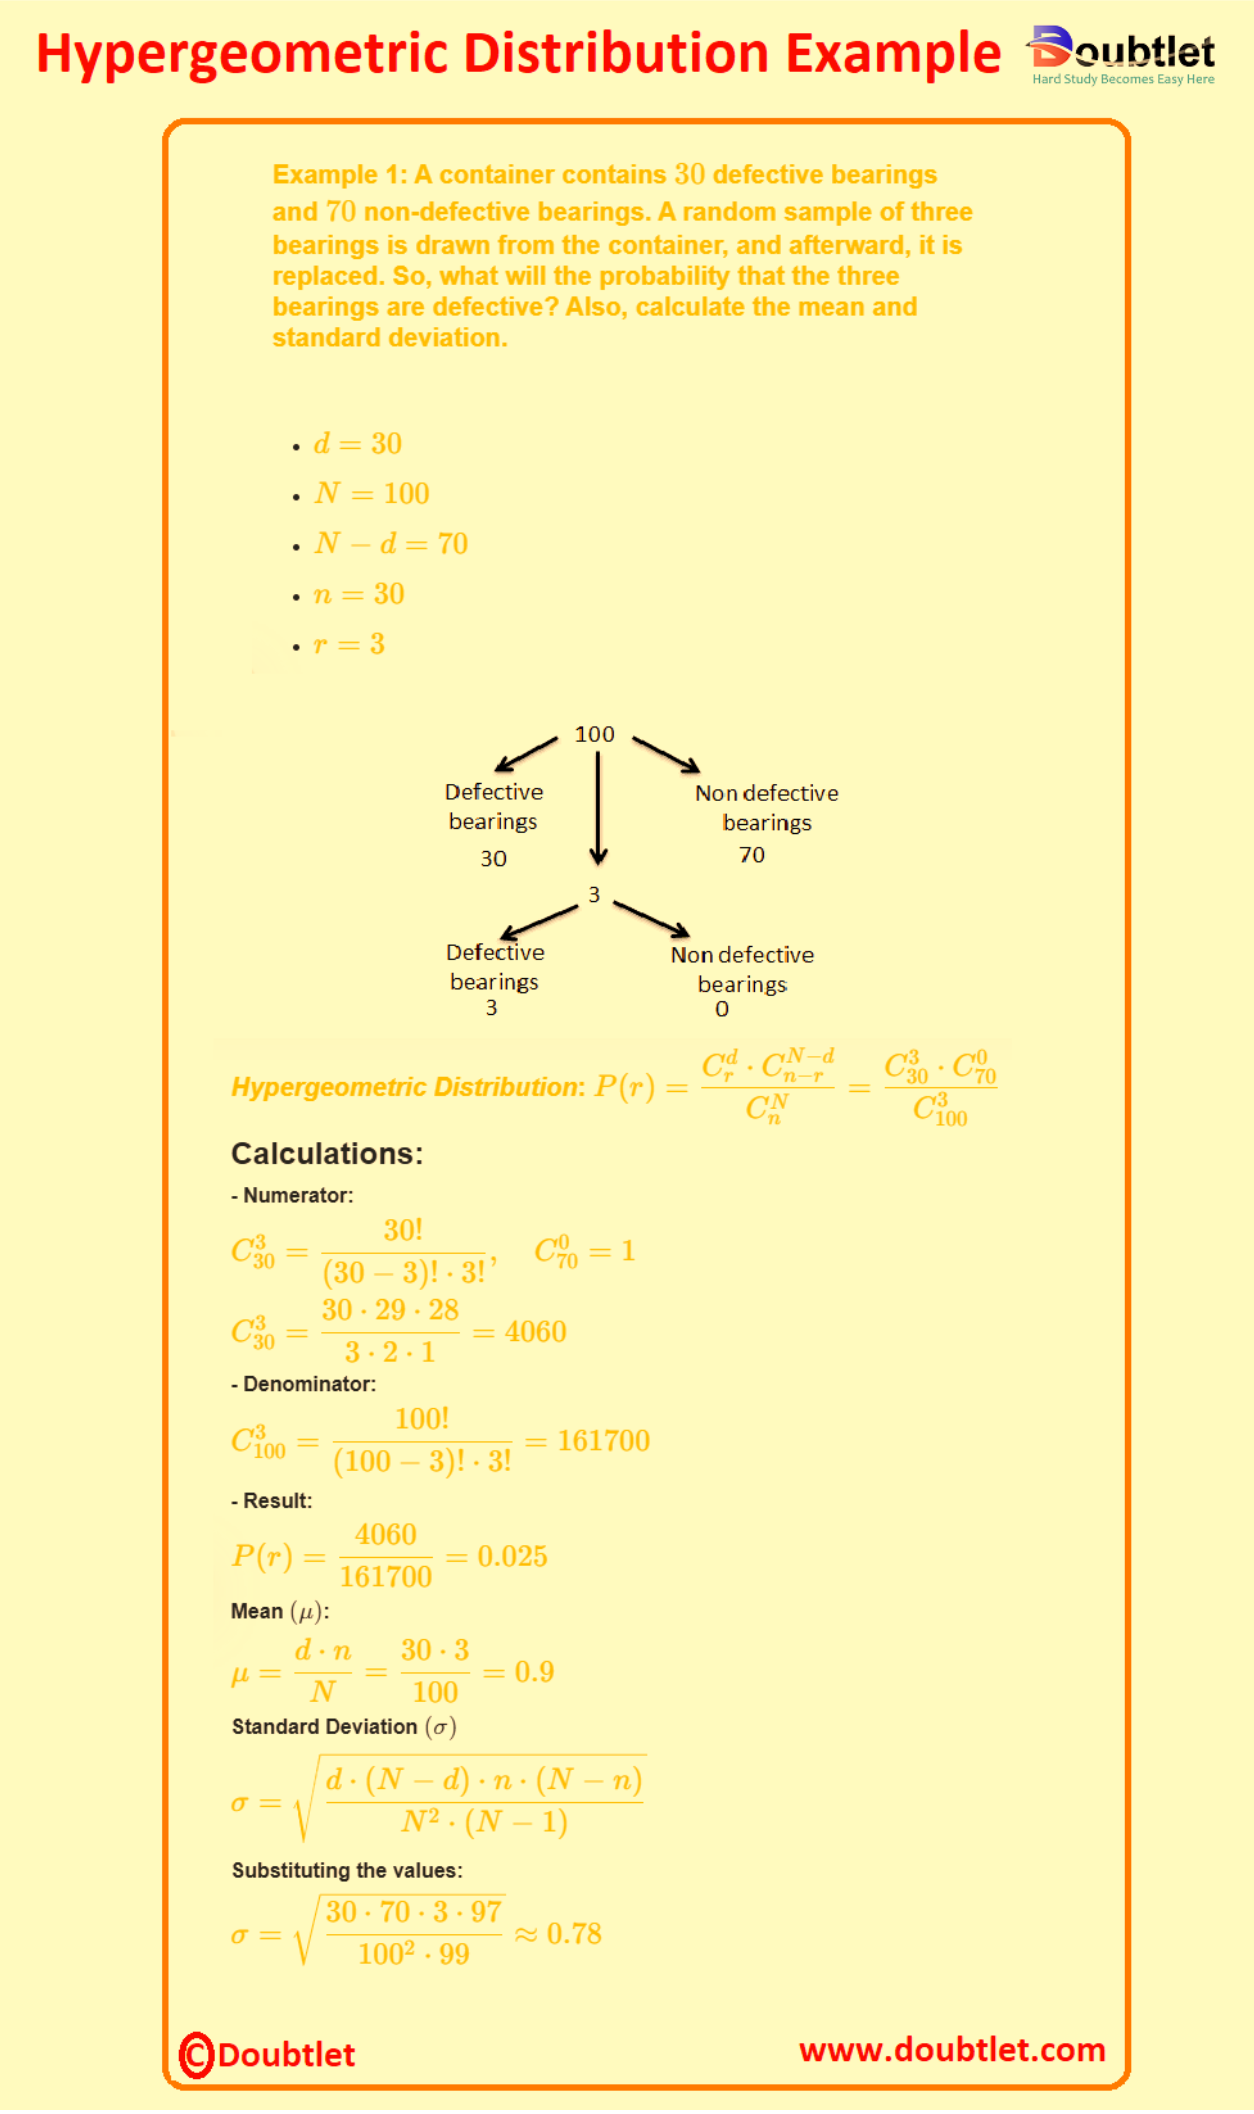
Solved Examples
Example 1: Quality Control
A batch of products contains defective items. If items are randomly selected, what is the probability that exactly items are defective?
Solution:
To solve this problem, we use the Hypergeometric Distribution, which models the probability of successes in draws without replacement from a finite population.
Step 1: Define the Parameters
-
: Total population size (total products in the batch),
-
: Number of successes (defective items),
-
: Number of draws (sample size),
-
: Desired number of successes in the sample.
The formula for the hypergeometric probability is:
Step 2: Compute Each Term
-
:
-
:
-
:
Step 3: Substitute the Values
Answer:
The probability that exactly items are defective is approximately .
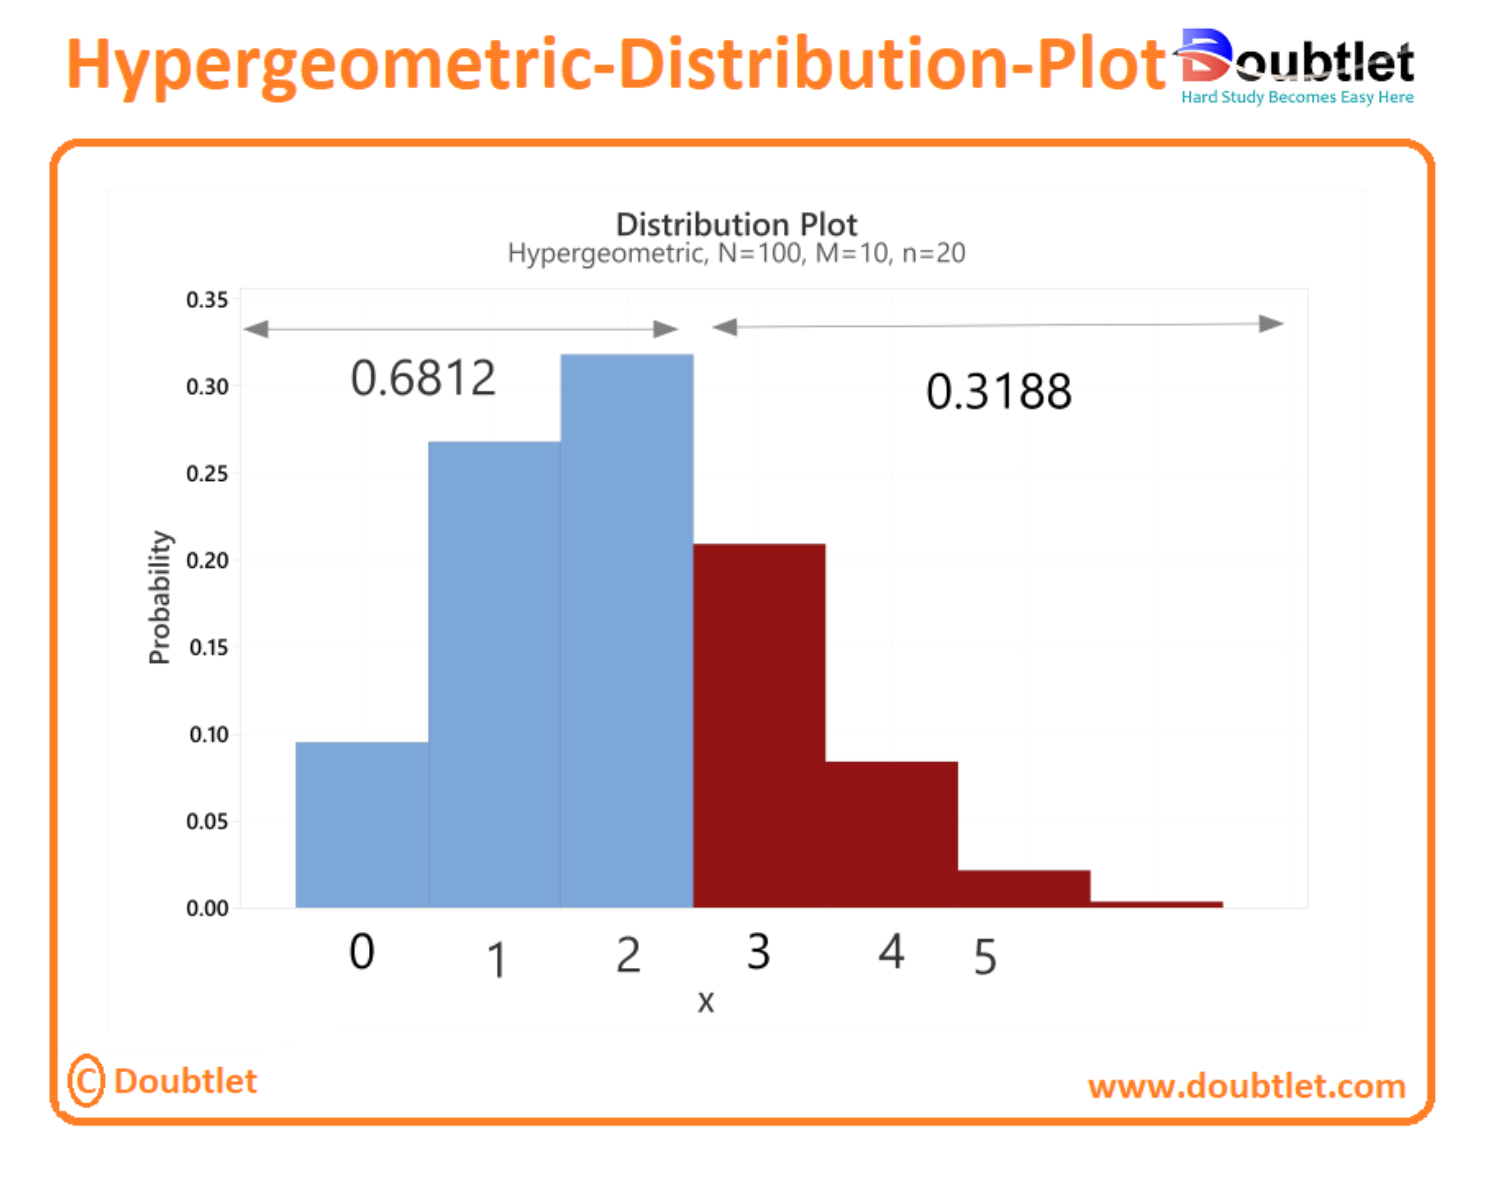
Step 4: Graph Explanation
Let’s visualize the probabilities for different values of (number of defective items in the sample).
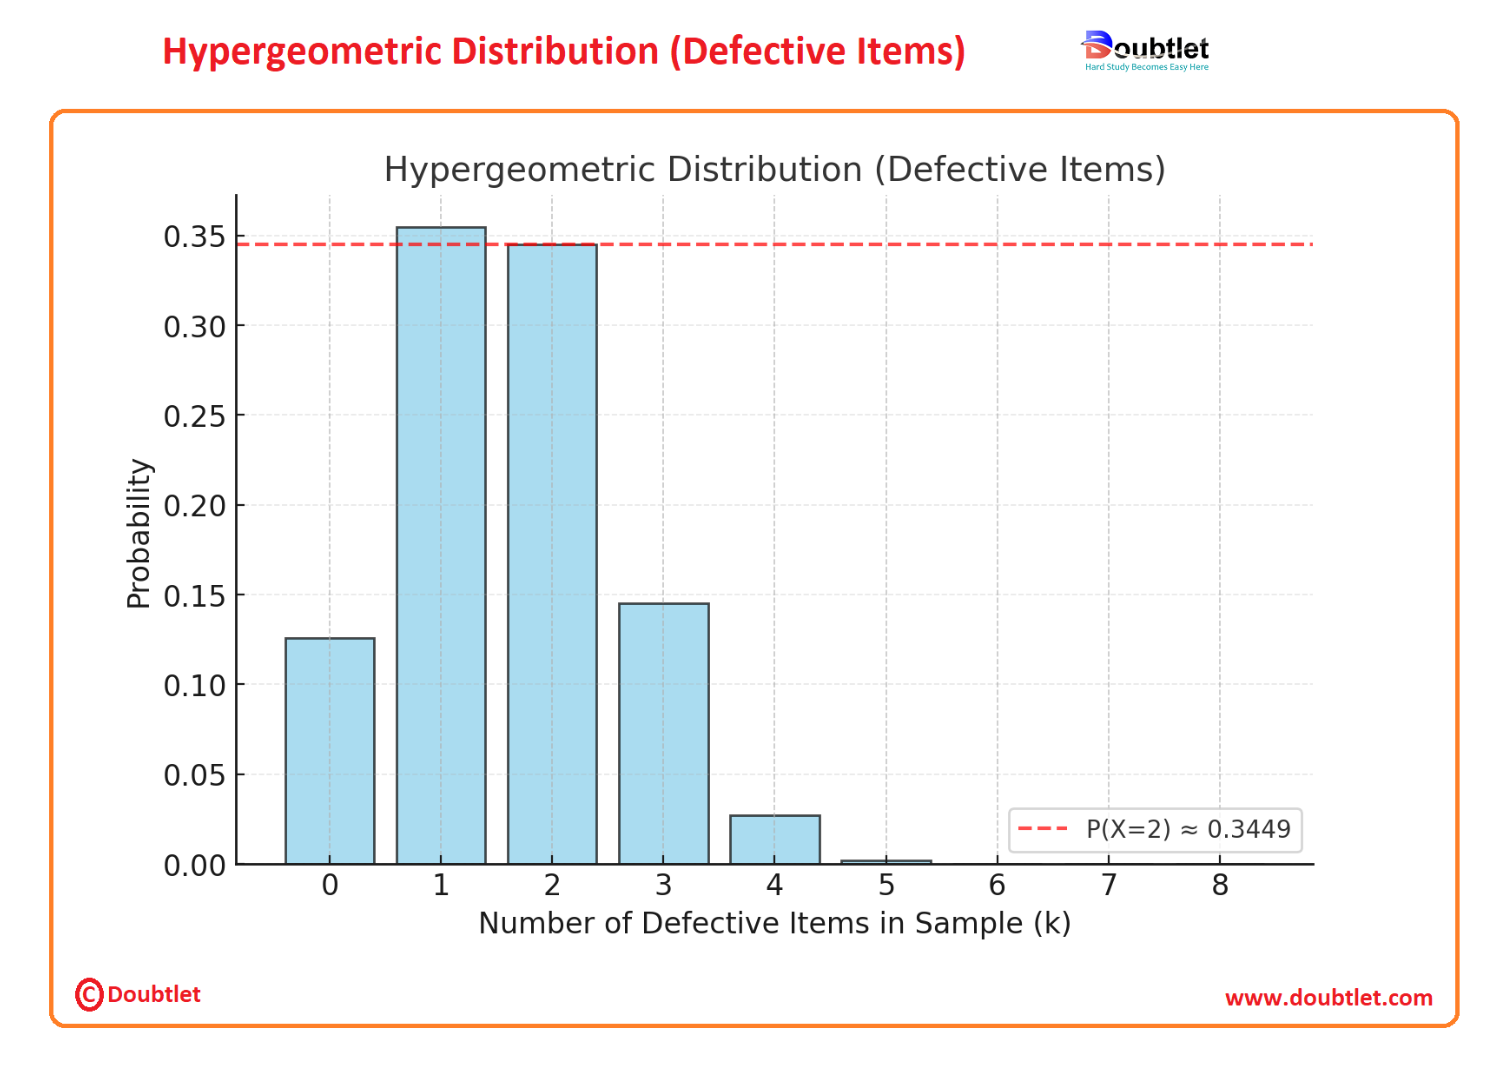
Explanation of the Graph:
-
X-Axis (k): Represents the number of defective items in the sample ( to ).
-
Y-Axis (Probability): Represents the probability of observing defective items in the sample.
-
Bars: Show the probabilities for each possible . The bar for is highlighted as it represents the desired outcome.
-
Red Dashed Line: Marks the probability for , which is approximately or 34.49%.
Key Insights:
-
The graph illustrates that the highest probability occurs around , aligning with the center of the hypergeometric distribution for this scenario.
-
The distribution is slightly skewed, reflecting the specific parameters of the population and sample size.
Example 2: Drawing Cards
A deck of cards contains hearts. What is the probability of drawing hearts in cards sampled without replacement?
Solution:
To solve this problem, we use the Hypergeometric Distribution to compute the probability of drawing fewer than hearts .
Step 1: Define the Parameters
-
: Total cards in the deck,
-
: Number of hearts in the deck,
-
: Number of cards drawn,
-
: Probability of drawing fewer than hearts.
The probability mass function (PMF) is:
We are interested in:
Step 2: Compute the Probabilities
1. Compute :
Substitute values:
2. Compute :
Substitute values:
3. Compute :
Substitute values:
Step 3: Sum the Probabilities
To compute :
Answer:
The probability of drawing fewer than 3 hearts is approximately 90.72%.
Step 4: Graph Explanation
Let’s visualize the probabilities for different values of (number of hearts drawn) and highlight to better understand the distribution of outcomes.
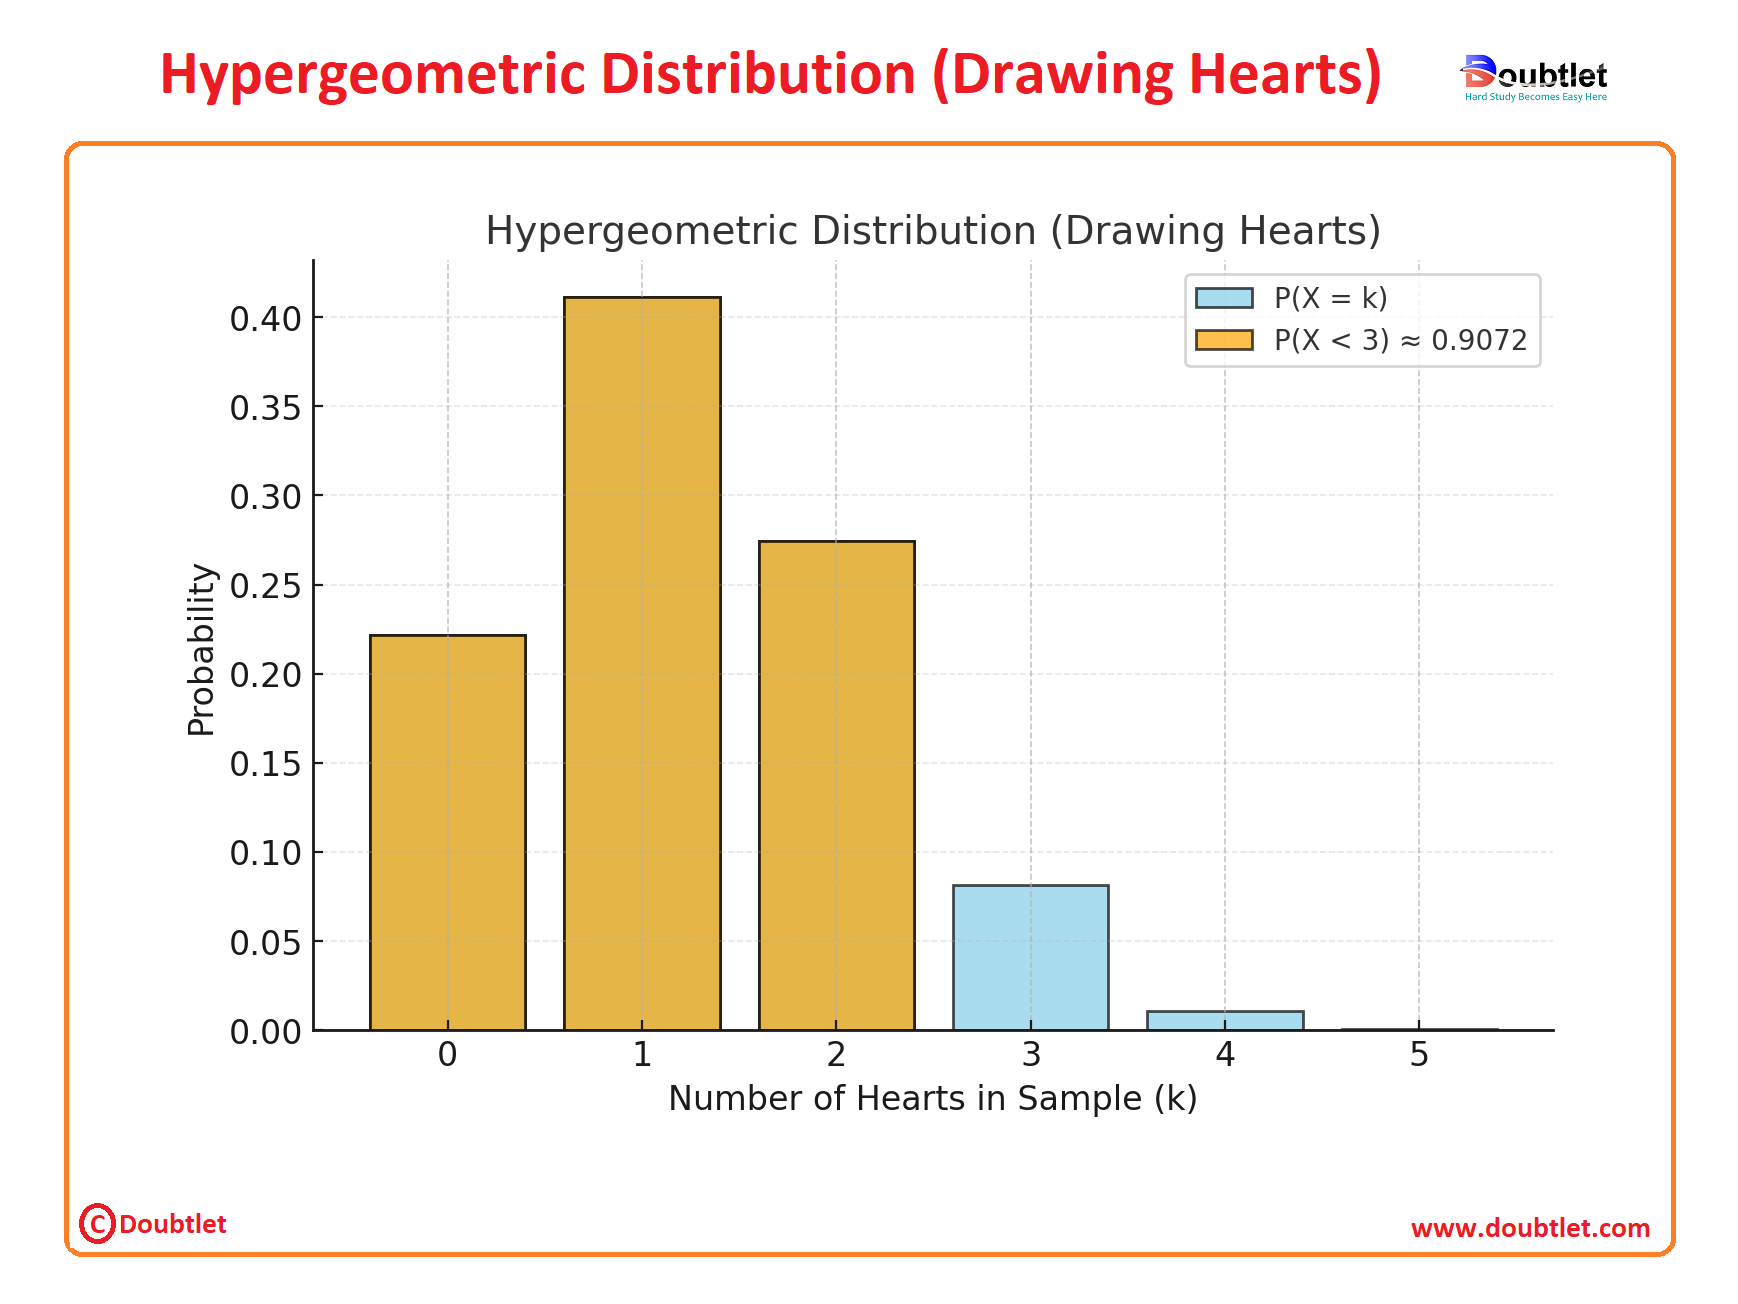
Explanation of the Graph:
-
X-Axis (k): Represents the number of hearts drawn from the sample ( to ).
-
Y-Axis (Probability): Represents the probability of drawing exactly hearts.
-
Orange Bars: Highlight the probabilities for , , and , representing .
-
Blue Bars: Represent the overall probabilities for all , showing the distribution of drawing hearts.
Key Insight:
The cumulative probability for is approximately 90.72%, as shown by the sum of the probabilities for , , and . This graph visually emphasizes how most of the probability mass lies in these values.
Example:
Suppose you have a batch of products, and you know that of them are defective. You want to determine the probability of selecting a sample of products from the batch and finding at least defective products.
To solve this problem, you can use the HYPGEOM.DIST function with the following arguments:
HYPGEOM.DIST
This will return the cumulative probability of finding at least defective products in a sample of products drawn from a batch of products with defective products.
4. Why Choose Our Hypergeometric Distribution Calculator?
Our calculator page provides a user-friendly interface that makes it accessible to both students and professionals. You can quickly input your square matrix and obtain the matrix of minors within a fraction of a second.
Our calculator saves you valuable time and effort. You no longer need to manually calculate each cofactor, making complex matrix operations more efficient.
Our calculator ensures accurate results by performing calculations based on established mathematical formulas and algorithms. It eliminates the possibility of human error associated with manual calculations.
Our calculator can handle all input values like integers, fractions, or any real number.
Alongside this calculator, our website offers additional calculators related to Pre-algebra, Algebra, Precalculus, Calculus, Coordinate geometry, Linear algebra, Chemistry, Physics, and various algebraic operations. These calculators can further enhance your understanding and proficiency.
5. A video based on how to Evaluate the Hypergeometric Distribution.
6. How to use this calculator?
Using the Hypergeometric Distribution Calculator is simple:
-
Input Parameters: Enter , , , and values into the table.
-
Click Calculate: Instantly view the probability results.
-
Analyze Outputs: Use the probabilities for reports, analysis, or decision-making.
Our tool ensures accuracy and efficiency, even for large datasets.
7. Solved Examples on Hypergeometric Distribution
Example 1:
A company inspects a batch of products , of which are defective . What is the probability of finding exactly defective products in a random sample of ?
Solution:
-
.
-
.
-
.
-
Probability:
Example 2: Tabular Data:
|
|
|
|
|
Probability |
|
|
|
|
|
|
|
|
|
|
|
|
Steps:
-
Input the values into the calculator.
-
Compute probabilities for each row using the formula.
8. Frequently Asked Questions (FAQs)
Q1. What is the Hypergeometric Distribution?
It models the probability of successes in draws from a finite population containing successes, without replacement.
Q2. How is it different from the Binomial Distribution?
The Hypergeometric Distribution involves sampling without replacement, whereas the Binomial Distribution assumes independent trials with replacement.
Q3. Is this calculator free?
Yes, our Hypergeometric Distribution Calculator is completely free to use.
Q4. Does it handle large datasets?
Absolutely, it’s optimized for tabular data and bulk calculations.
Q5. Can it calculate cumulative probabilities?
Yes, the calculator can compute both individual and cumulative probabilities.
Q6. Is it mobile-friendly?
Yes, it works seamlessly on any device.
Q7. Can I export the results?
Yes, you can download the results for further use.
Q8. Does it show intermediate steps?
Yes, the calculator provides detailed calculations for better understanding.
9. What are the real-life applications?
The Hypergeometric Distribution is widely used in:
-
Quality Control: Identify defective items in a batch.
-
Genetics: Model allele frequencies in populations.
-
Market Research: Analyze survey responses from a finite sample.
-
Education: Assess probabilities in classroom statistics.
-
Lottery Systems: Calculate odds of winning specific prize categories.
Fictional Anecdote: Sarah, a quality control manager, uses our Hypergeometric Distribution Calculator to determine the likelihood of finding defective products in random batch samples. With accurate insights, she optimizes inspection processes and ensures product quality.
10. Conclusion
The Hypergeometric Distribution Calculator is a powerful tool for solving complex probability problems. Its ability to handle tabular data, ensure accuracy, and save time makes it indispensable for professionals and students alike.
Ready to enhance your probability analysis? Try our Hypergeometric Distribution Calculator today and experience the ease of precise computations!
If you have any suggestions regarding the improvement of the content of this page, please write to me at My Official Email Address: doubt@doubtlet.com
Are you Stuck on homework, assignments, projects, quizzes, labs, midterms, or exams?
To get connected to our tutors in real time. Sign up and get registered with us.
Scientific Notation calculator
Discriminant Calculator
Normal Distribution Calculator
Laplace Transform Calculator
X and Y Intercepts Calculator
FOIL Method Calculator
Fraction to Percent Calculator