


Linear Regression (Line of best fit) Calculator
This calculator will help you to calculate the best line fit equation for the given set of values with steps shown.Related Calculators:Quadratic Regression Calculator

Neetesh Kumar | January 05, 2025
Share this Page on:
![]()
![]()
![]()
![]()
![]()
- 1. Introduction to the Linear Regression (Line of best fit) Calculator
- 2. What is the Formulae used
- 3. How do I find the Linear Regression (Line of best fit)?
- 4. Why choose our Linear Regression (Line of best fit) Calculator?
- 5. A Video for explaining this concept
- 6. How to use this calculator?
- 7. Solved Examples on Linear Regression (Line of Best Fit)
- 8. Frequently Asked Questions (FAQs)
- 9. What are the real-life applications?
- 10. Conclusion
Data analysis can be daunting, but understanding trends and making predictions doesn’t have to be. The Linear Regression (Line of Best Fit) Calculator for a Table is here to simplify your tasks, providing accurate results with minimal effort. Whether you're a student, researcher, or business analyst, this tool is your go-to for uncovering meaningful patterns in data.
1. Introduction to the Linear Regression (Line of best fit) Calculator
Linear regression is the backbone of predictive analytics. It helps establish a relationship between two variables, showing how one affects the other. The line of best fit represents this relationship visually on a graph. Our Linear Regression Calculator is designed to work seamlessly with tabular data, automatically calculating the slope, intercept, and regression equation.
Imagine you're tracking marketing spend versus sales. A line of best fit shows whether your investment is yielding returns or if it's time to rethink strategies.
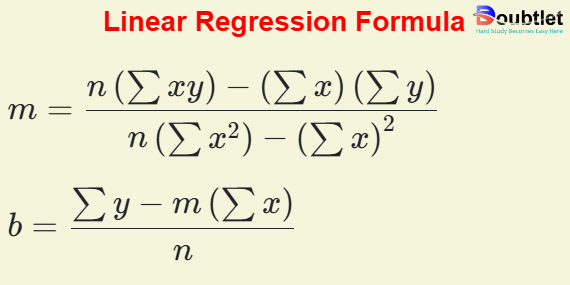
2. What is the Formulae used?
The Linear Regression equation is:
Where:
- : Dependent variable
- : Independent variable
- : Slope of the line (rate of change)
- : -intercept (value of when )
To calculate (slope) and (intercept):
These formulas ensure accurate computation, even for complex datasets.
3. How do I find the Linear Regression (Line of best fit)?
Manually finding the line of best fit involves:
- Organizing your data: Arrange it in a table format with and values.
- Calculating the slope (): Use the formula to determine the rate of change.
- Finding the intercept (): Calculate where the line crosses the -axis.
- Plotting the equation: Draw the line on a graph using .
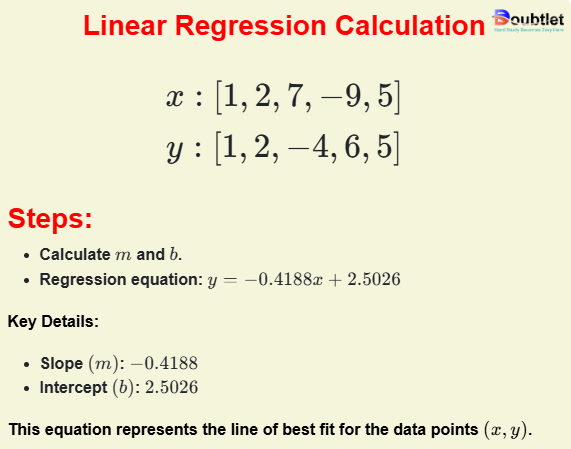
Example: Dataset:
Steps:
- Calculate and .
- Regression equation:
Why bother with manual steps when our calculator does it all instantly?
4. Why choose our Linear Regression (Line of best fit) Calculator for a Table?
Our calculator page provides a user-friendly interface that makes it accessible to both students and professionals. You can quickly input your square matrix and obtain the matrix of minors within a fraction of a second.
Our calculator saves you valuable time and effort. You no longer need to manually calculate each cofactor, making complex matrix operations more efficient.
Our calculator ensures accurate results by performing calculations based on established mathematical formulas and algorithms. It eliminates the possibility of human error associated with manual calculations.
Our calculator can handle all input values like integers, fractions, or any real number.
Alongside this calculator, our website offers additional calculators related to Pre-algebra, Algebra, Precalculus, Calculus, Coordinate geometry, Linear algebra, Chemistry, Physics, and various algebraic operations. These calculators can further enhance your understanding and proficiency.
5. A video based on how to Evaluate the Linear Regression (Line of best fit).
6. How to use this calculator?
Here’s how you can make the most of our calculator:
- Input your data: Enter and values in tabular format.
- Click calculate: Instantly get the slope, intercept, and regression equation.
- View the graph: See the line of best fit plotted over your data.
No more staring at equations our tool does the heavy lifting for you.
7. Solved Examples on Linear Regression (Line of Best Fit)
Example 1:
Find the Linear Regression for the dataset:
Solution:
- Calculate slope and intercept .
- Regression equation: .
The Line of best fit is: .
Example 2: Tabular Data:
| Hours Studied | Test Score |
| 2 | 50 |
| 4 | 65 |
| 6 | 80 |
| 8 | 95 |
Solution:
- Calculate slope and intercept .
- Regression equation: .
The Line of best fit is: .
Our calculator provides these results within seconds, complete with a graph.
8. Frequently Asked Questions (FAQs)
Q1. What is linear regression?
It’s a statistical method to model the relationship between a dependent and an independent variable.
Q2. Can this calculator handle large datasets?
Yes, it supports thousands of rows of data.
Q3. Is it free to use?
Absolutely, it’s free.
Q4. Can I use it for multiple variables?
This calculator currently supports single-variable linear regression.
Q5. Does it show graphs?
Yes, it plots the line of best fit for visual analysis.
Q6. Is this tool mobile-friendly?
Yes, you can use it on any device.
Q7. Can it handle negative values?
Of course, negative values are fully supported.
Q8. Do I need to download anything?
No downloads required it’s entirely web-based.
9. What are the real-life applications?
Linear regression is everywhere:
- Business: Predict sales based on marketing spend.
- Education: Analyze study hours versus test scores.
- Healthcare: Examine the relationship between lifestyle habits and health outcomes.
- Finance: Forecast stock prices based on historical data.
- Science: Study correlations in experimental data.
A fictional anecdote: Picture Alex, a small-business owner analyzing sales trends. By using our Linear Regression Calculator, Alex identifies a positive correlation between social media ads and revenue. Armed with this insight, Alex scales up marketing efforts and doubles sales in six months.
10. Conclusion
The Linear Regression (Line of Best Fit) Calculator is more than just a tool it’s a gateway to making data-driven decisions. Whether you’re analyzing business trends, academic performance, or scientific data, this calculator ensures that you get accurate, actionable insights in seconds.
Ready to take control of your data? Give it a try today and see how easy regression analysis can be.
If you have any suggestions regarding the improvement of the content of this page, please write to me at My Official Email Address: doubt@doubtlet.com
Are you Stuck on homework, assignments, projects, quizzes, labs, midterms, or exams?
To get connected to our tutors in real time. Sign up and get registered with us.
InterQuartile Range Calculator
Difference Quotient Calculator
Range of Data Set Calculator
Percentile Rank Calculator
Euler's Method calculator
Quadratic Regression (Parabola of best fit) Calculator
Root Mean Square (RMS) Value Calculator
Covariance Calculator
Standard Deviation Calculator