


Margin of Error Calculator
This calculator will help you to calculate the margin of error for the given sample size and distribution with steps shown.Related Calculators:Box and Whisker Plot Calculator
Loading...

Neetesh Kumar | January 14, 2025
Share this Page on:
![]()
![]()
![]()
![]()
![]()
- 1. Introduction to the Margin of Error Calculator
- 2. What is the Formulae used
- 3. How do I find the Margin of Error?
- 4. Why Choose Our Margin of Error Calculator?
- 5. A Video for explaining this concept
- 6. How to use this calculator?
- 7. Solved Examples on Margin of Error
- 8. Frequently Asked Questions (FAQs)
- 9. What are the real-life applications?
- 10. Conclusion
The Margin of Error (MOE) is a critical statistic used to quantify the uncertainty in survey results, polls, and research studies. The Margin of Error Calculator for a Table makes this process seamless by automating calculations for various datasets. Whether you’re a student, researcher, or data analyst, this tool ensures accurate and reliable results.
1. Introduction to the Margin of Error Calculator
The Margin of Error represents the range within which the true value of a population parameter lies, based on a sample. It’s essential for understanding the reliability of your data and is often used in conjunction with confidence intervals.
Our Margin of Error Calculator is designed for tabular data, making it easy to calculate MOE for multiple datasets at once. Whether analyzing survey responses or experimental outcomes, this calculator simplifies your statistical analysis.
2. What is the Formulae used?
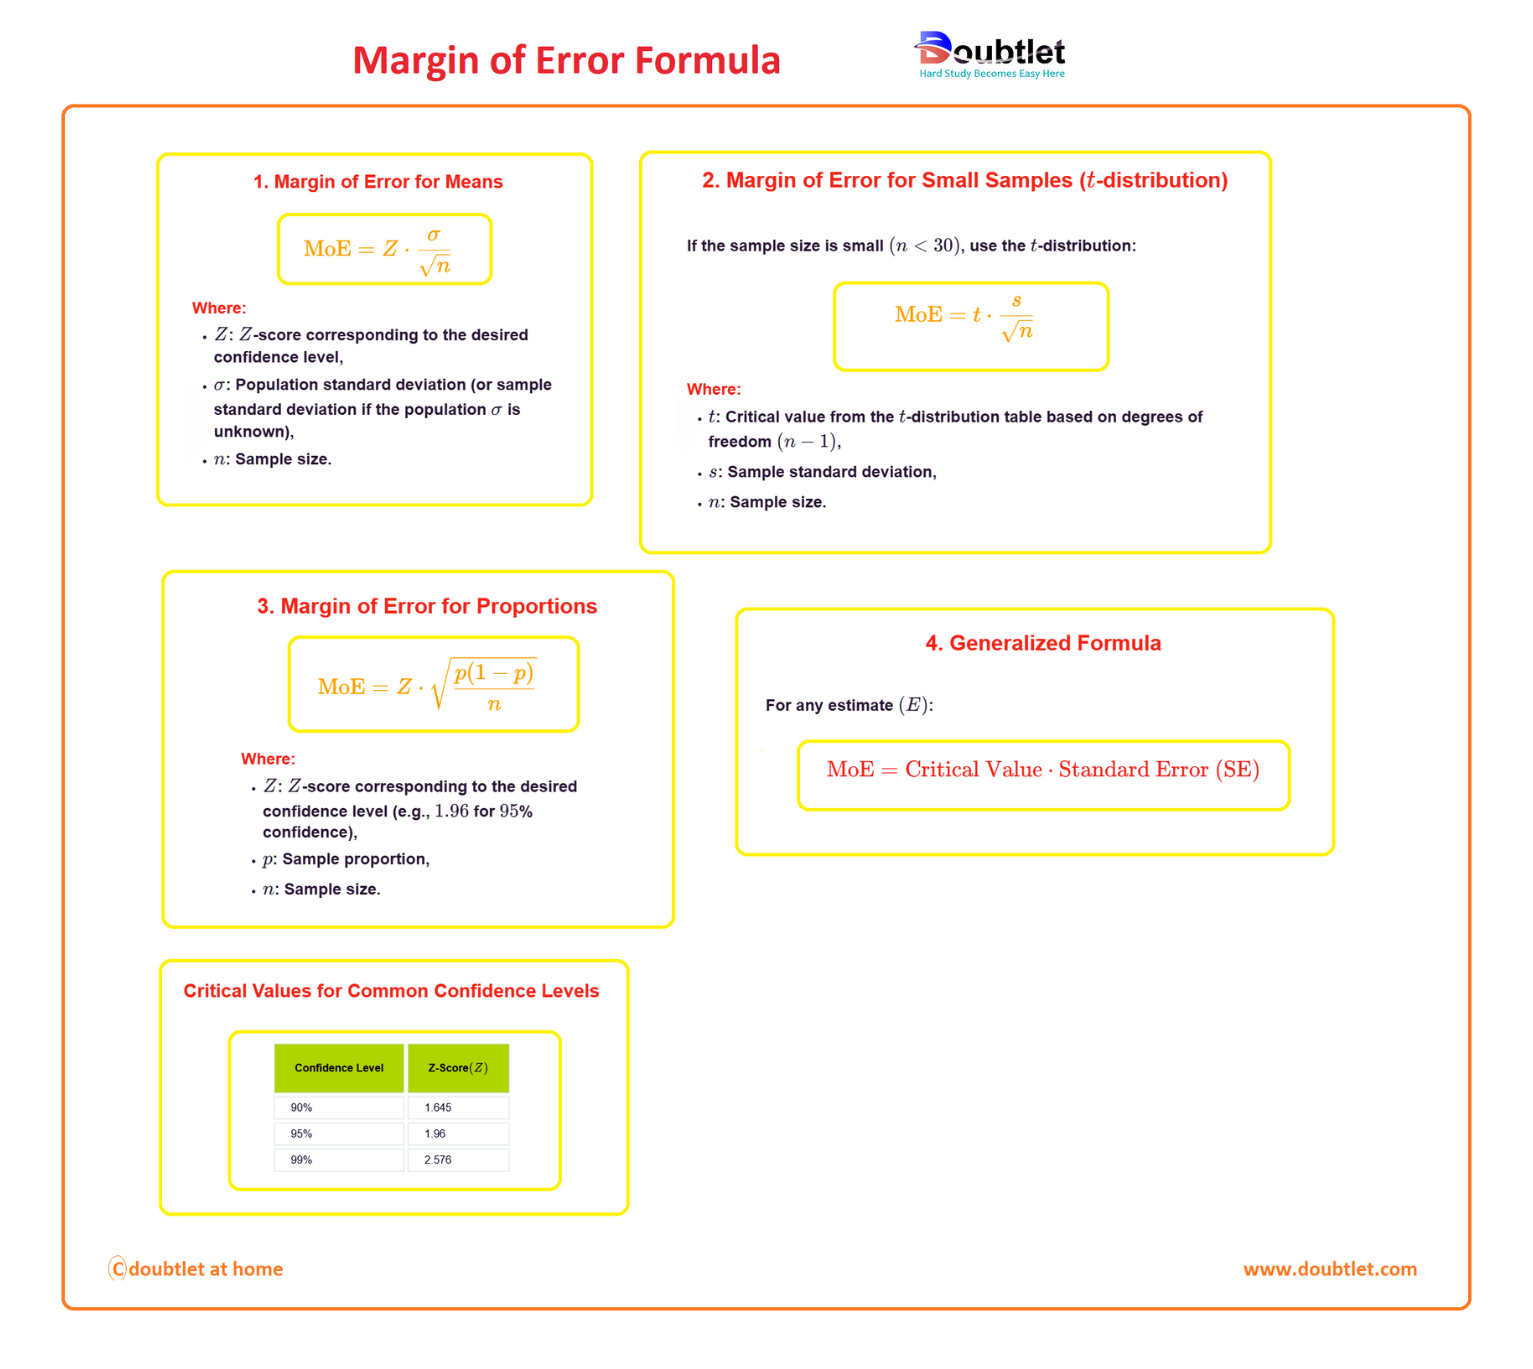
The Margin of Error (MoE) is a statistical measure that quantifies the range of uncertainty around a sample estimate. The formula varies slightly based on the context (e.g., proportions, means). Below are the commonly used formulas:
1. Margin of Error for Means
Where:
- : -score corresponding to the desired confidence level,
- : Population standard deviation (or sample standard deviation if the population is unknown),
- : Sample size.
2. Margin of Error for Small Samples (-distribution)
If the sample size is small , use the -distribution:
Where:
- : Critical value from the -distribution table based on degrees of freedom ,
- : Sample standard deviation,
- : Sample size.
3. Margin of Error for Proportions
Where:
- : -score corresponding to the desired confidence level (e.g., for confidence),
- : Sample proportion,
- : Sample size.
4. Generalized Formula
For any estimate :
Critical Values for Common Confidence Levels
|
| ||||||
| 90% | 1.645 | ||||||
| 95% | 1.96 | ||||||
| 99% | 2.576 |
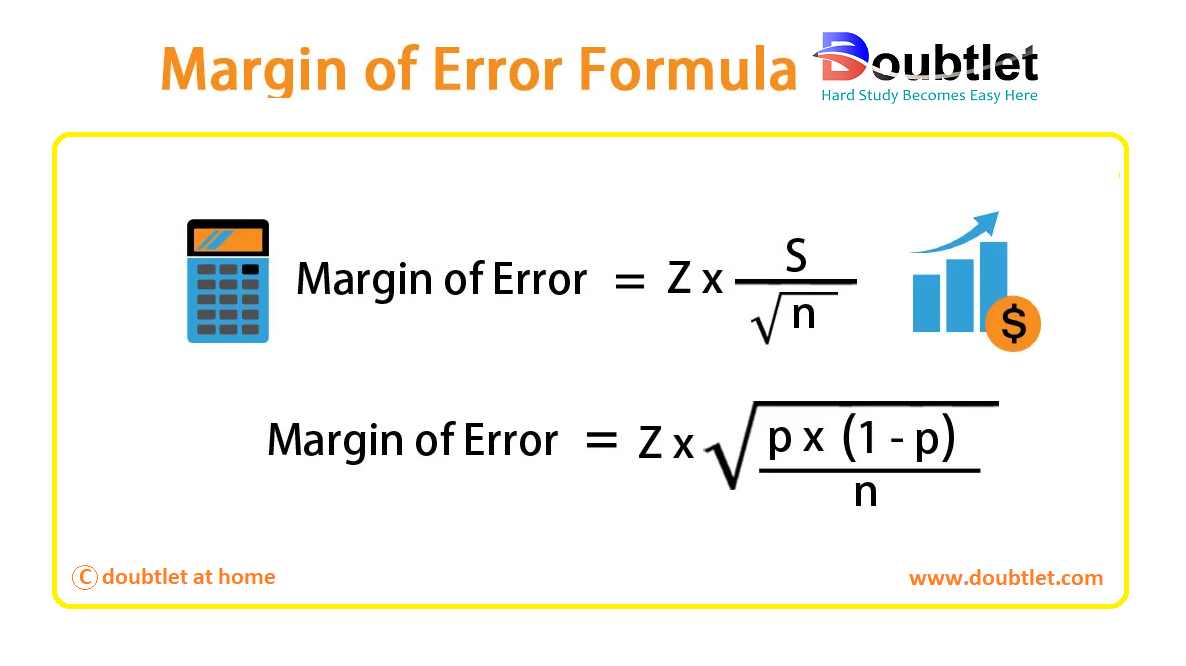
Margin of Error Formulas
Formula 1:
Where:
- Z: Z-score
- S: Standard Deviation of a population
- n: Sample Size
Formula 2:
Where:
- : Sample Proportion (fraction of the sample that is a success)
what is the margin of error in statistics?
The margin of error is a range of values below and above the sample statistic in a confidence interval.
The margin of error is an interval estimate is a pair of percentages surrounding a guess about some attribute of full population-based over a random sample from that population.
“Margin of error allows us to feel confident a certain percentage of the time, within a range above or below the ideal guess, represented by a margin we believe is least in error”
In probability sampling, every member of a population has a probability of being select to a part of a sample. In this method, researchers and statisticians can select members from their area of research so that a margin of error in data received from these samples is as minimum as possible.
non-probability sampling, samples are formed over the basis of cost-effectiveness or convenience and not over the basis of application and because of this selection process, some sections of the population may get excluded.
3. How Do I Find the Margin of Error?
To Calculate the Margin of Error Manually:
- Identify Parameters: Determine the sample size , confidence level, and standard deviation or .
- Find the Z or T-Score: Use a Z or T table to find the score corresponding to your confidence level.
- Apply the Formula: Substitute the values into the appropriate formula.
Example:
A survey with respondents has a sample standard deviation of . What’s the MOE at a confidence level?
-
Sample Size :
-
T-Score : (from T table)
-
Margin of Error:
The MOE is approximately . For large datasets, our calculator automates this process.
Margin of Error (MoE) Overview
The Margin of Error (MoE) represents the range within which the true population parameter is expected to lie with a certain level of confidence. It is commonly used in polling, surveys, and statistical estimates.
The formula for the Margin of Error is:
Where:
- : Z-score corresponding to the confidence level (e.g., for confidence),
- : Population standard deviation (or sample standard deviation if is unknown),
- : Sample size.
Example 1: Estimating Proportion
A survey was conducted to estimate the proportion of voters supporting a candidate. Out of a sample of voters, supported the candidate. Find the margin of error for a confidence level.
Solution:
-
Given:
- Sample proportion ,
- Sample size ,
- Confidence level = .
-
Calculate Standard Error (SE):
The formula for standard error for proportions is:Substituting values:
-
Calculate Margin of Error (MoE):
-
Interpretation:
The margin of error is , or .
The true proportion of voters supporting the candidate lies within .
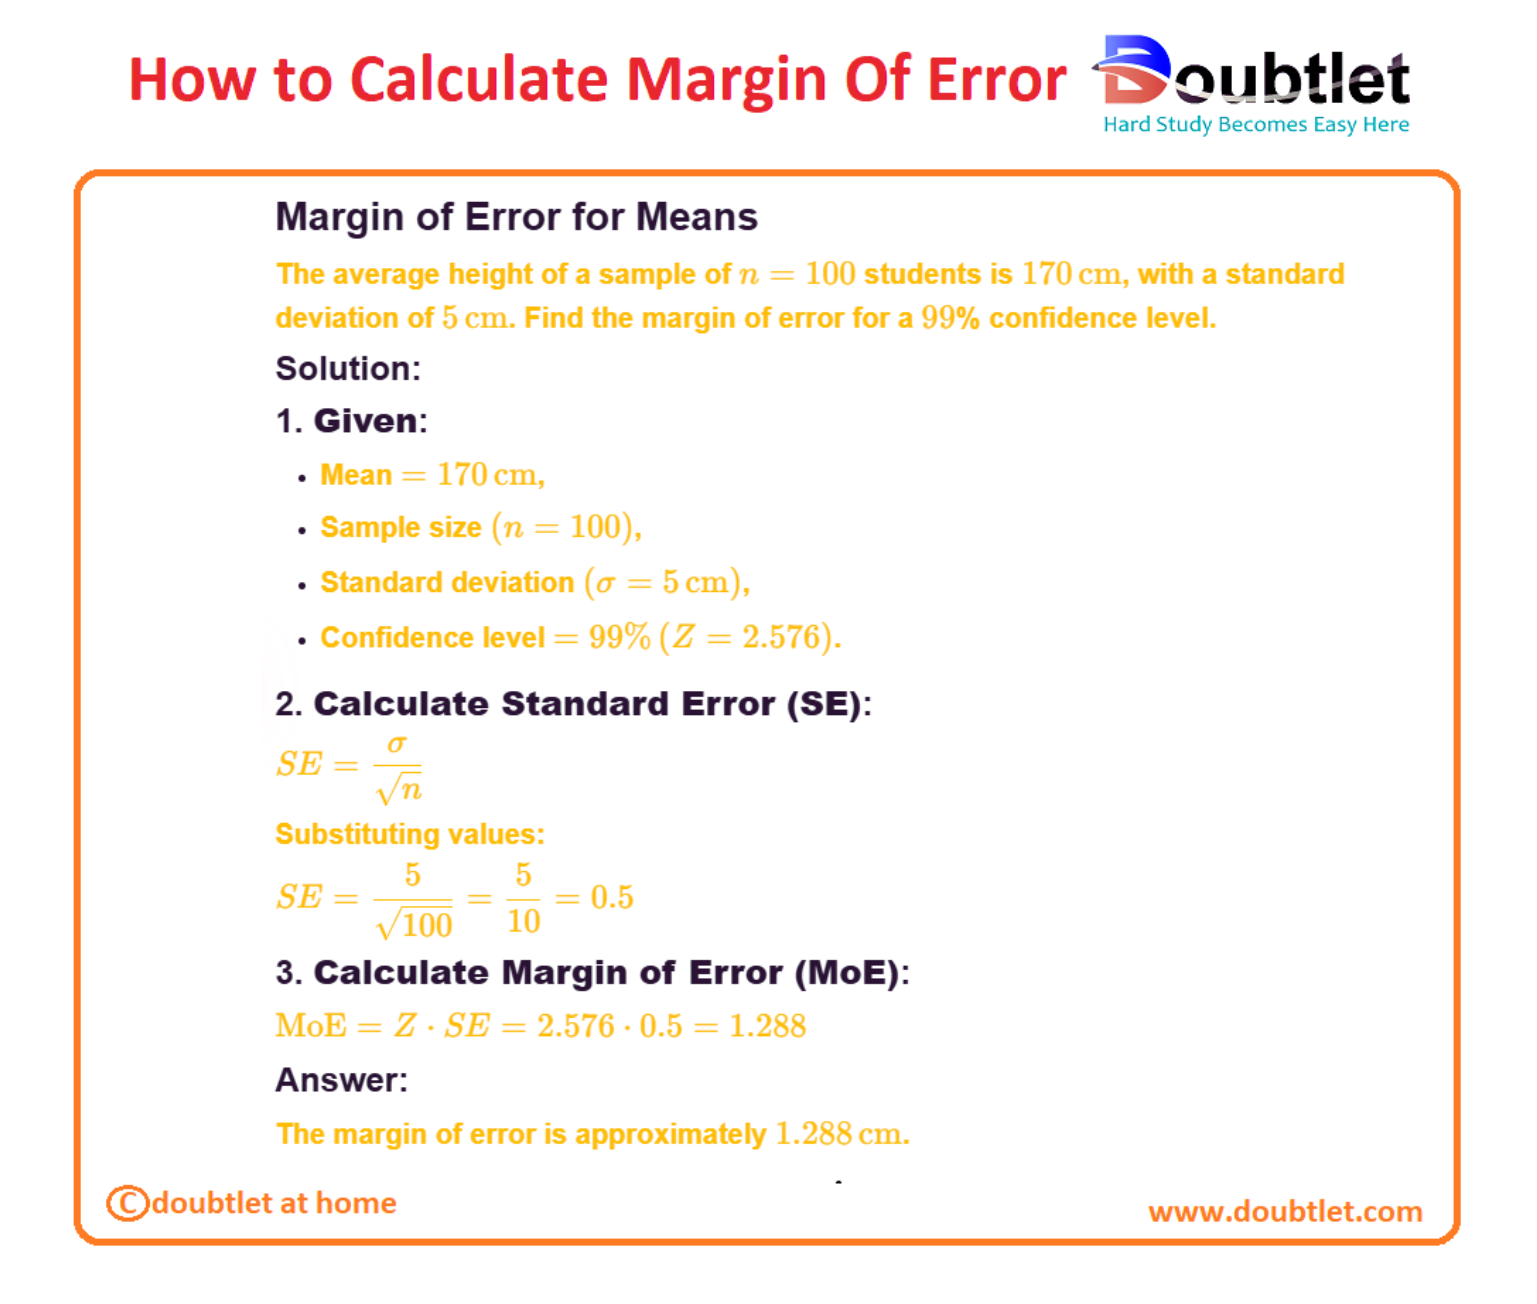
Example 2: Estimating Mean
The average weight of a sample of apples is , with a standard deviation of . Find the margin of error for a confidence level.
Solution:
-
Given:
- Sample mean ,
- Sample size ,
- Standard deviation ,
- Confidence level = .
-
Calculate Standard Error (SE):
The formula for standard error is:Substituting values:
-
Calculate Margin of Error (MoE):
-
Interpretation:
The margin of error is .
The true mean weight lies within .
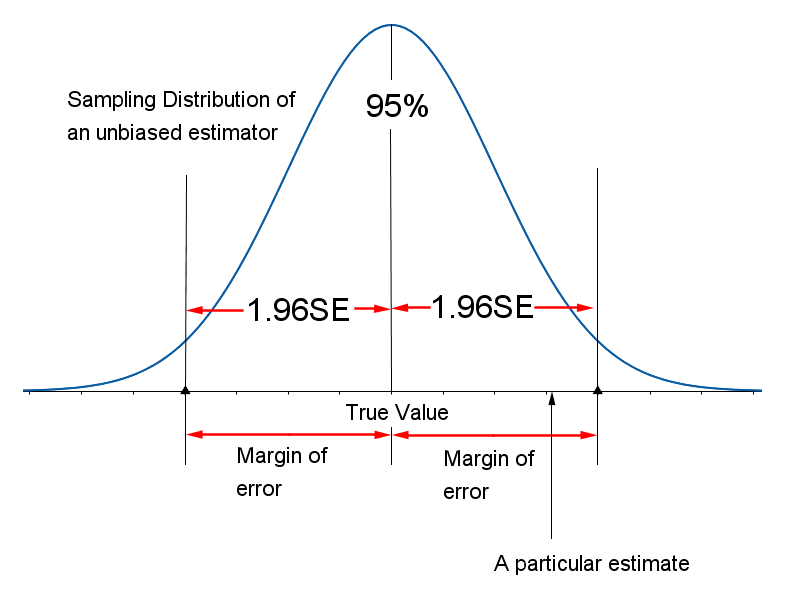
Graph Explanation
Let me plot an example graph for the margin of error with a confidence level for a proportion estimate.
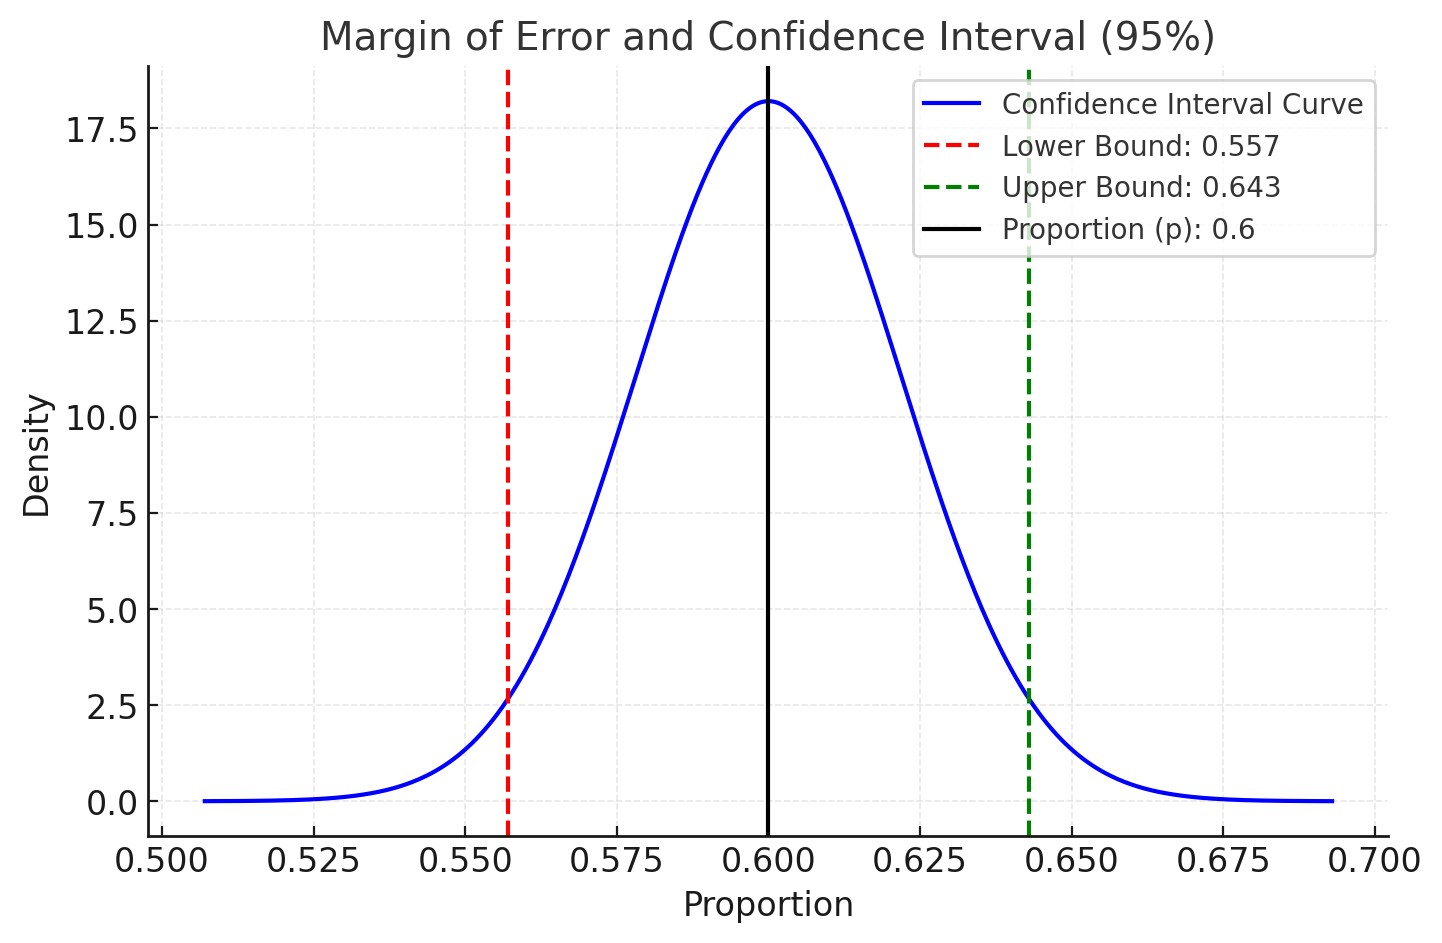
Explanation of the Margin of Error Graph:
-
Curve:
The blue curve represents the confidence interval's probability density function for the sample proportion and a confidence level. -
Proportion :
The vertical black line at shows the sample proportion. -
Lower Bound:
The red dashed line indicates the lower bound of the confidence interval . -
Upper Bound:
The green dashed line shows the upper bound of the confidence interval . -
Interpretation:
The true population proportion is expected to lie within the shaded interval with confidence.
This visualization shows how the margin of error expands or contracts based on the confidence level, sample size, and variability in the data.
4. Why Choose Our Margin of Error Calculator?
Our calculator page provides a user-friendly interface that makes it accessible to both students and professionals. You can quickly input your square matrix and obtain the matrix of minors within a fraction of a second.
Our calculator saves you valuable time and effort. You no longer need to manually calculate each cofactor, making complex matrix operations more efficient.
Our calculator ensures accurate results by performing calculations based on established mathematical formulas and algorithms. It eliminates the possibility of human error associated with manual calculations.
Our calculator can handle all input values like integers, fractions, or any real number.
Alongside this calculator, our website offers additional calculators related to Pre-algebra, Algebra, Precalculus, Calculus, Coordinate geometry, Linear algebra, Chemistry, Physics, and various algebraic operations. These calculators can further enhance your understanding and proficiency.
5. A video based on how to Evaluate the Margin of Error.
6. How to use this calculator?
Using the Margin of Error Calculator is Straightforward:
- Input Data: Enter your sample size, confidence level, and standard deviation.
- Select Calculation Type: Choose between Z or T-Score based on your data.
- Click Calculate: Instantly view the Margin of Error and related statistics.
Our calculator removes the guesswork, delivering precise and actionable results.
7. Solved Examples on Margin of Error
Example 1:
A study of students has a population standard deviation of . What’s the MOE for a confidence level?
Solution:
-
Z-Score : (for ).
-
Margin of Error:
Example 2: Tabular Data:
|
Sample Size | Standard Deviation | Confidence Level | MOE |
| 200 | 20 | 90% | Calculate |
| 100 | 15 | 95% | Calculate |
Steps:
-
Input each row into the calculator.
-
Compute the MOE for each dataset instantly.
Our calculator handles these calculations quickly and efficiently.
8. Frequently Asked Questions (FAQs)
Q1. What is the Margin of Error?
The Margin of Error quantifies the range within which the true population parameter is likely to fall, based on a sample.
Q2. How is it related to confidence intervals?
The MOE is half the width of the confidence interval.
Q3. Is the calculator free?
Yes, our Margin of Error Calculator is completely free to use.
Q4. Does it work for small sample sizes?
Yes, it supports both small and large samples using T-Scores and Z-Scores.
Q5. Can it handle tabular data?
Absolutely, it’s optimized for analyzing datasets arranged in tables.
Q6. Is it mobile-compatible?
Yes, the calculator works seamlessly on all devices.
Q7. Can I download the results?
Yes, outputs can be exported for further analysis.
Q8. Does it show intermediate steps?
Yes, detailed calculations are displayed for better understanding.
9. What are the real-life applications?
The Margin of Error is Widely Used Across Various Fields:
- Polling: Analyze the reliability of survey results.
- Market Research: Assess confidence in customer feedback or product ratings.
- Education: Evaluate test score distributions and reliability.
- Healthcare: Interpret confidence intervals in clinical trials.
- Business Analytics: Gauge uncertainty in forecasting models.
Fictional Anecdote: Emily, a market researcher, uses our Margin of Error Calculator to validate survey results on a new product launch. By ensuring the MOE is within acceptable limits, she confidently presents findings to stakeholders, leading to a successful product strategy.
10. Conclusion
The Margin of Error Calculator is an essential tool for anyone conducting surveys, experiments, or statistical research. It simplifies complex calculations, ensures accuracy, and provides quick insights into the reliability of your data.
Ready to enhance your statistical analysis? Try our Margin of Error Calculator today and unlock the power of precise, reliable calculations!
If you have any suggestions regarding the improvement of the content of this page, please write to me at My Official Email Address: doubt@doubtlet.com
Are you Stuck on homework, assignments, projects, quizzes, labs, midterms, or exams?
To get connected to our tutors in real time. Sign up and get registered with us.
Exponential Distribution Calculator
Geometric Distribution Calculator
Decimal to Percent calculator
Percent to Decimal calculator
Percent to Fraction calculator
Scientific Notation calculator
Discriminant Calculator