


Normal Distribution Calculator
This calculator will help you to obtain the Normal distribution with steps for given input values.Related Calculators:Beta Distribution CalculatorBinomial Distribution Calculator
Loading...
Loading...
Loading...

Neetesh Kumar | January 17, 2025
Share this Page on:
![]()
![]()
![]()
![]()
![]()
- 1. Introduction to the Normal Distribution Calculator
- 2. What is the Formulae used
- 3. How do I find the Normal Distribution?
- 4. Why choose our Normal Distribution Calculator?
- 5. A Video for explaining this concept
- 6. How to use this calculator?
- 7. Solved Examples on Normal Distribution
- 8. Frequently Asked Questions (FAQs)
- 9. What are the real-life applications?
- 10. Conclusion
The Normal Distribution, often referred to as the bell curve, is a cornerstone of probability and statistics. It models a wide range of real-world phenomena, making it a fundamental concept for students, researchers, and data analysts. The Normal Distribution Calculator for a Table simplifies these calculations, helping you compute probabilities, percentiles, and more in seconds.
1. Introduction to the Normal Distribution Calculator
The Normal Distribution is a continuous probability distribution characterized by its symmetric bell shape. It’s defined by two parameters: the mean and the standard deviation .
Our Normal Distribution Calculator is designed to handle tabular data, making it ideal for bulk calculations and large datasets. Whether you’re calculating probabilities, -scores, or cumulative areas under the curve, this tool streamlines the process for professionals and students alike.
2. What is the Formulae used?
The Probability Density Function (PDF) of the Normal Distribution:
The PDF is given by:
Where:
- : Random variable.
- : Mean of the distribution.
- : Standard deviation of the distribution.
- : Mathematical constant .
- : Euler’s number .
Cumulative Distribution Function (CDF):
The CDF gives the probability that is less than or equal to :
The CDF is used to calculate cumulative probabilities, while the PDF is used for probability densities.
What is Normal Distribution Formula?
The normal distribution is symmetric, i.e., one can divide the positive and negative values of the distribution into equal halves; therefore, the mean, median, and mode will be equal. It has two tails. One is known as the right tail, and the other one is known as the left tail.
The normal distribution formula calculator gives the analyst a distribution of data points where majority of the data points converge at the middle and the rest keep spreading towards the extremes of the graph. It is also referred to as Gaussian distribution that appears as a bell curve when charted on a graph.
What is the Probability density function of the normal distribution?
The normal distribution is described by two parameters: the mean, , and the standard deviation, . We write:
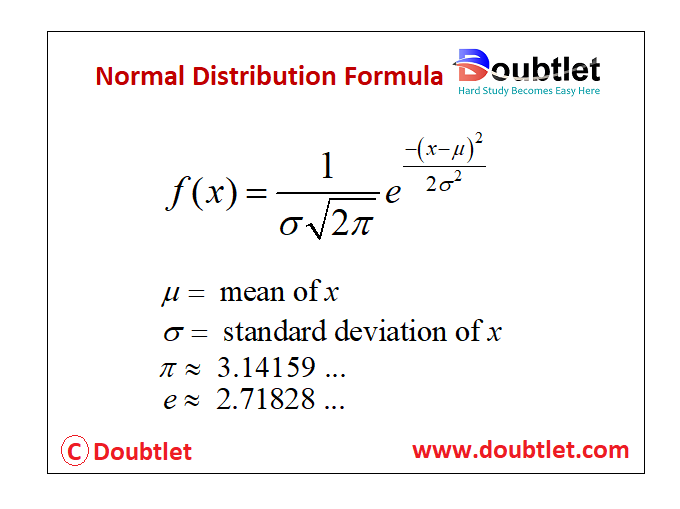
The following diagram shows the formula for the Normal Distribution. Scroll down the page for more examples and solutions on using the normal distribution formula.
Since the formula is so complex, using it to determine area under the curve is cumbersome and time consuming. Instead, tables and software are used to find the probabilities for the normal distribution. This will be discussed in the lesson on -Score.
What Is Normal Distribution Formula?
The normal distribution is defined by the probability density function for the continuous random variable considered in the system. It is a function whose integral across an interval (say to ) gives the probability of the random variable , by considering the values between and . Since there will be infinite values between and , a range of is considered, and a continuous probability density function is defined as:
For a normal distribution of a random variable with the mean = and the variance = , the probability density is given by:
An equivalent representation:
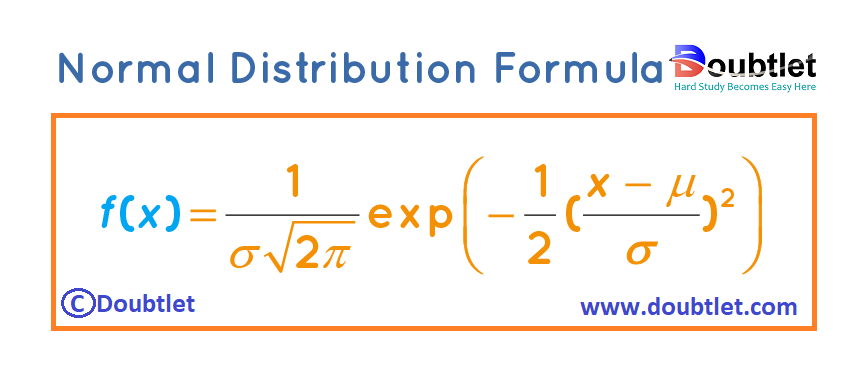
For a specific and a ranging from to , the probability density function (p.d.f.) is as:
The probability density function of normal or Gaussian distribution is given by:
Where,
is the variable,
is the mean,
is the standard deviation.
3. How Do I Find the Normal Distribution?
To compute probabilities for a Normal Distribution manually:
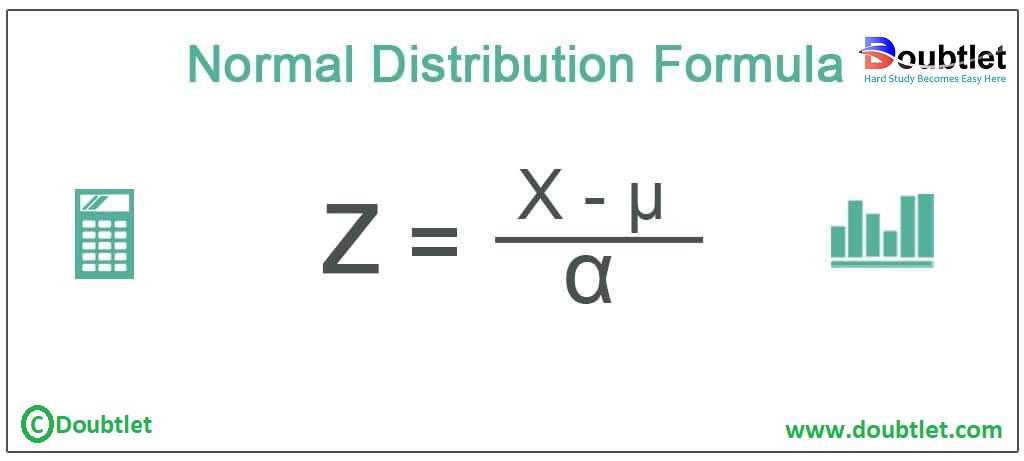
- Standardize the Variable: Convert to a -score using:
-
Use Z-Tables or Technology: Find the cumulative probability corresponding to the -score.
-
Interpret the Result: Determine the probability for the desired range or value.
Example:
A dataset has a mean of and a standard deviation of . What is the probability that ?
-
Z-Score:
-
From a -table, .
-
Probability:
For multiple values or large datasets, our calculator handles these calculations with ease.
Understanding the Normal Distribution
The Normal Distribution, also known as the Gaussian distribution, is a continuous probability distribution characterized by its bell-shaped curve. It is defined by two parameters:
- (mean): The center of the distribution.
- (standard deviation): The spread of the distribution.
The probability density function (PDF) of the Normal Distribution is:
Properties of the Normal Distribution
- Symmetry: The curve is symmetric about the mean .
- Rule: Approximately:
- of data lies within standard deviation of the mean ,
- lies within standard deviations ,
- lies within standard deviations .
Solved Examples
Example 1: Probability within 1 Standard Deviation
For a normal distribution with and , what percentage of data lies between and ?
Solution:
-
Convert and to their z-scores:
-
For : ,
-
For : .
-
-
Use the z-table or a calculator to find the cumulative probability:
-
,
-
.
-
-
Subtract:
Answer: Approximately of data lies between and .
Example 2: Probability Beyond 2 Standard Deviations
For the same normal distribution , , what percentage of data lies beyond ?
Solution:
-
Convert 70 to its z-score:
-
Use the -table to find :
-
From the -table, ,
-
Therefore, .
-
Answer: Approximately of data lies beyond .
Example 3: Finding the 90th Percentile
For a normal distribution , , find the value of such that .
Solution:
-
The -score corresponding to :
- From the -table, .
-
Convert the -score to the original scale:
Answer: The th percentile is approximately .
Graph Explanation
Let’s plot the normal distribution for and , highlighting areas corresponding to the above examples.
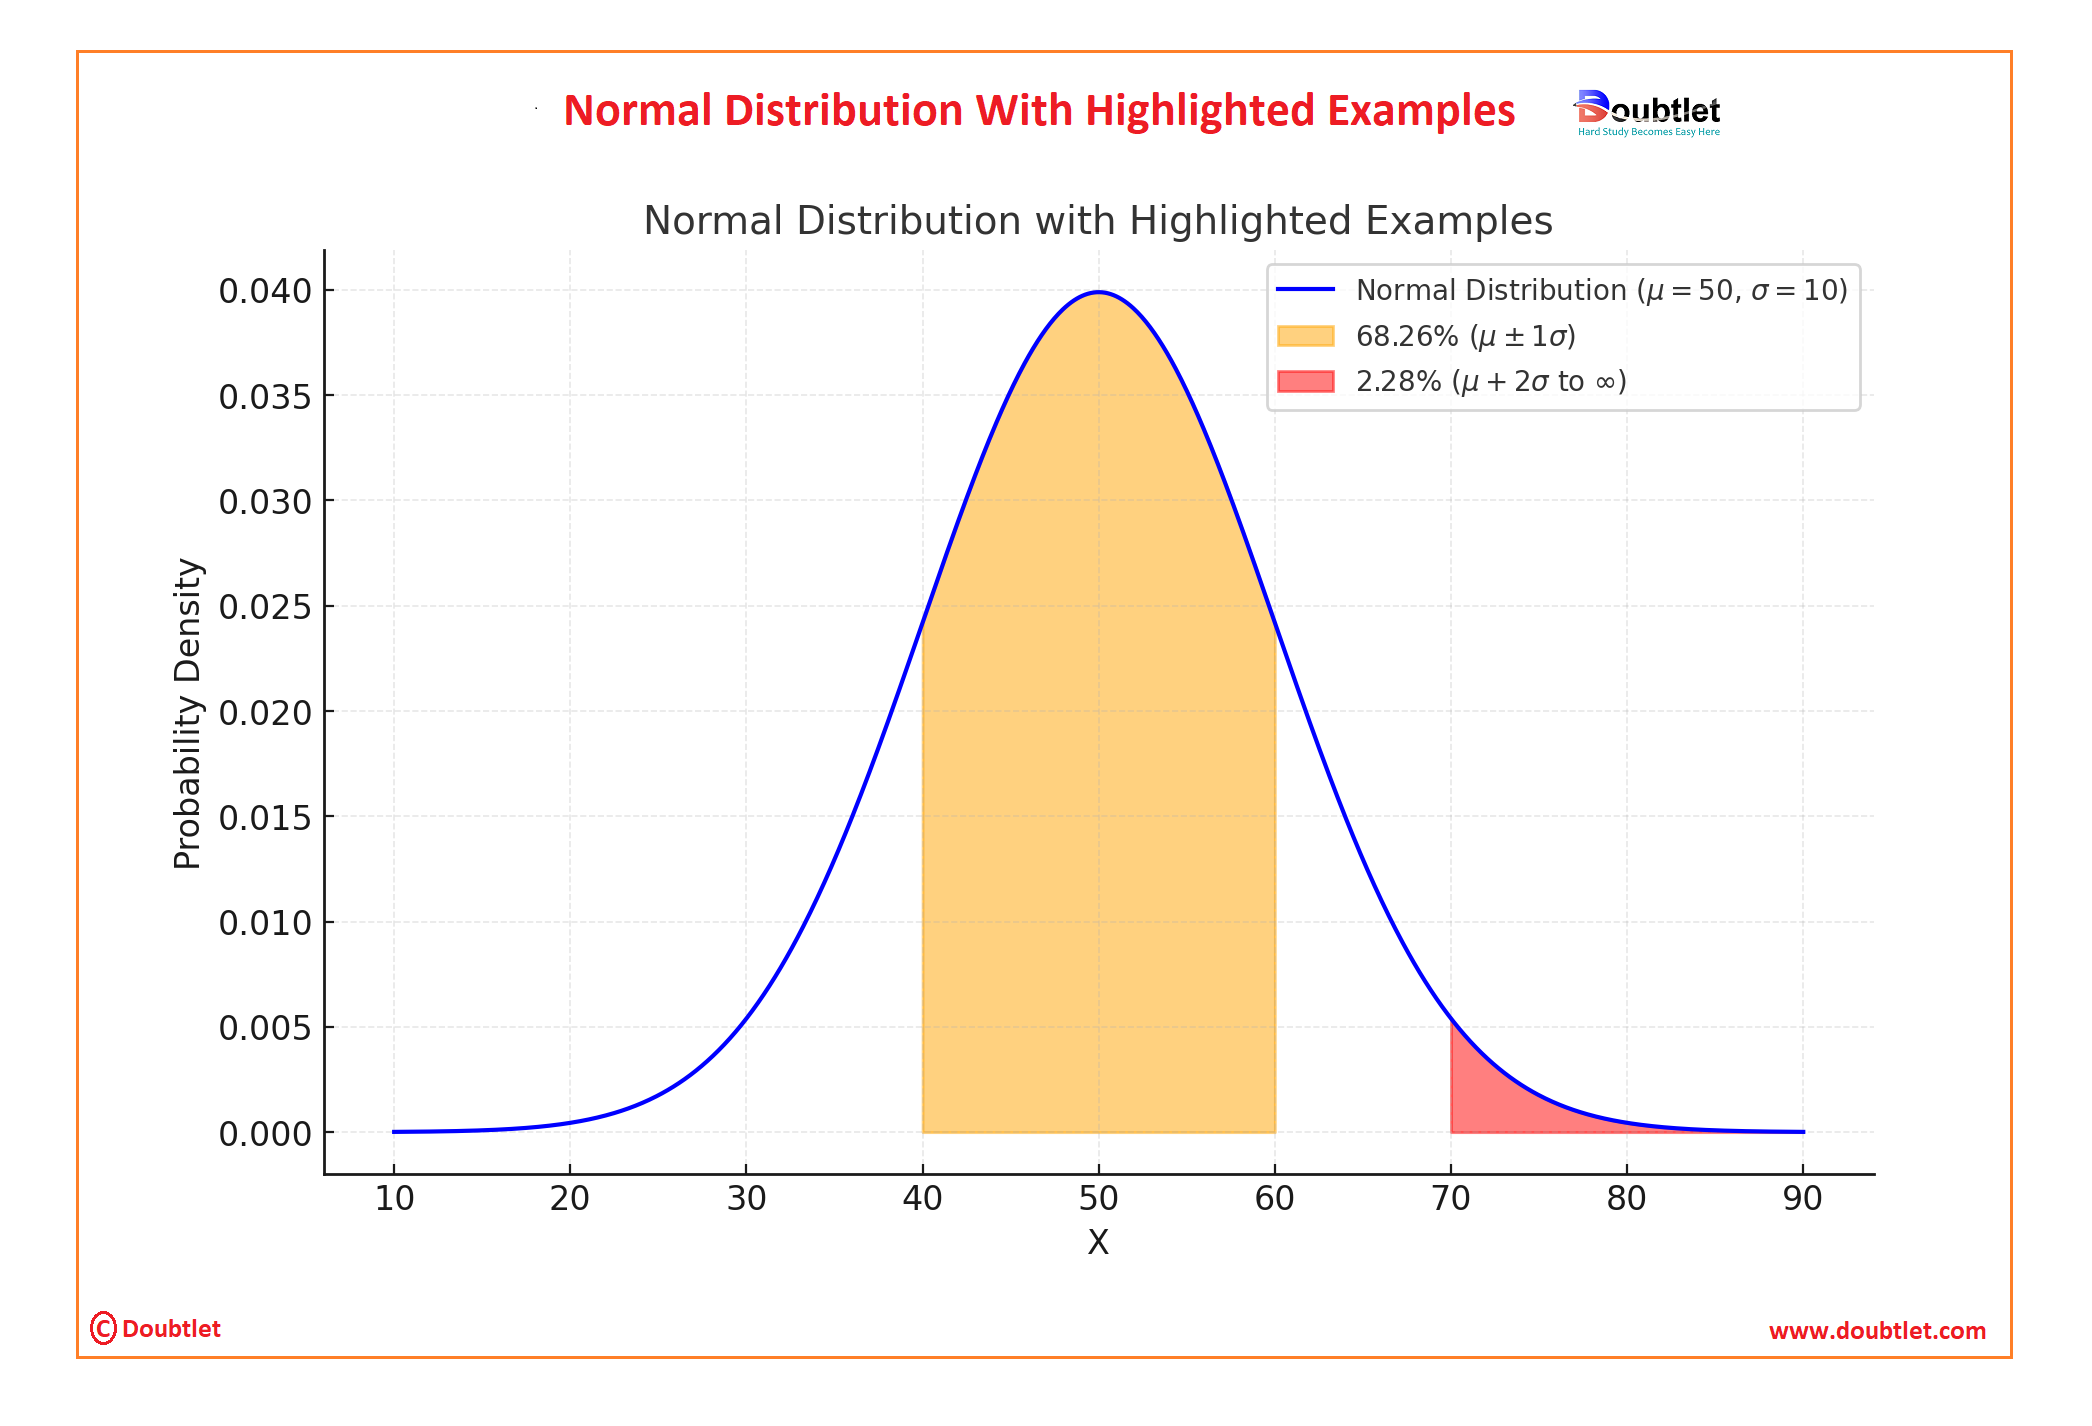
Explanation of the Graph:
-
Blue Curve: Represents the normal distribution with and .
-
Orange Shaded Region: Shows the area under the curve between and (), which corresponds to approximately of the data.
-
Red Shaded Region: Highlights the area beyond , which corresponds to approximately of the data.
Key Insights:
- The graph visually demonstrates the rule for the normal distribution.
- Shading helps to interpret probabilities associated with specific intervals or regions under the curve.
4. Why Choose Our Normal Distribution Calculator?
Our calculator page provides a user-friendly interface that makes it accessible to both students and professionals. You can quickly input your square matrix and obtain the matrix of minors within a fraction of a second.
Our calculator saves you valuable time and effort. You no longer need to manually calculate each cofactor, making complex matrix operations more efficient.
Our calculator ensures accurate results by performing calculations based on established mathematical formulas and algorithms. It eliminates the possibility of human error associated with manual calculations.
Our calculator can handle all input values like integers, fractions, or any real number.
Alongside this calculator, our website offers additional calculators related to Pre-algebra, Algebra, Precalculus, Calculus, Coordinate geometry, Linear algebra, Chemistry, Physics, and various algebraic operations. These calculators can further enhance your understanding and proficiency.
5. A video based on how to Evaluate the Normal Distribution.
6. How to use this calculator?
Using the Normal Distribution Calculator is Simple:
-
Input Parameters: Enter the mean , standard deviation , and the value(s) of .
-
Select Output Type: Choose probabilities, -scores, or cumulative areas.
-
Click Calculate: Instantly view the results in tabular format.
This tool saves time and ensures accurate results, even for complex datasets.
7. Solved Examples on Normal Distribution
Example 1:
Problem:
A company’s delivery times are normally distributed with minutes and minutes. What is the probability that a delivery takes less than minutes?
Solution:
-
-Score:
-
From a -table, .
-
Probability:
Example 2: Tabular Data:
|
|
|
|
-Score |
Probability |
|
|
|
|
|
|
|
|
|
|
|
|
Steps:
-
Input the mean, standard deviation, and values into the calculator.
-
Compute -scores and probabilities for each row.
8. Frequently Asked Questions (FAQs)
Q1. What is the Normal Distribution?
It’s a continuous probability distribution with a symmetric bell shape, defined by its mean and standard deviation .
Q2. How is it used in statistics?
It’s used to model real-world data, compute probabilities, and perform hypothesis testing.
Q3. What is a -score?
A -score measures how many standard deviations a value is from the mean.
Q4. Is this calculator free?
Yes, our Normal Distribution Calculator is completely free.
Q5. Does it handle large datasets?
Yes, it’s optimized for processing tabular data efficiently.
Q6. Can it calculate cumulative probabilities?
Yes, it computes both individual and cumulative probabilities.
Q7. Is it mobile-friendly?
Yes, the calculator works seamlessly on all devices.
Q8. Can I download the results?
Yes, the output can be exported for further analysis.
9. What are the real-life applications?
The Normal Distribution is Widely Used Across Various Fields:
-
Education: Analyze test score distributions.
-
Finance: Model stock returns and risk.
-
Healthcare: Assess patient health metrics like blood pressure.
-
Manufacturing: Monitor product quality through process control.
-
Social Sciences: Study population behaviors and trends.
Fictional Anecdote: John, a marketing analyst, uses our Normal Distribution Calculator to predict customer purchase patterns. With precise insights, he improves campaign targeting, boosting sales by .
10. Conclusion
The Normal Distribution Calculator is a powerful tool for anyone working with probability and statistics. It simplifies complex calculations, ensures accuracy, and saves time, making it ideal for professionals, students, and researchers alike.
Ready to enhance your statistical analysis? Try our Normal Distribution Calculator today and discover the ease of accurate probability computations!
If you have any suggestions regarding the improvement of the content of this page, please write to me at My Official Email Address: doubt@doubtlet.com
Are you Stuck on homework, assignments, projects, quizzes, labs, midterms, or exams?
To get connected to our tutors in real time. Sign up and get registered with us.
Discriminant Calculator
Hypergeometric Distribution Calculator
Laplace Transform Calculator
X and Y Intercepts Calculator
FOIL Method Calculator
Fraction to Percent Calculator
Logarithm Calculator