


P Value Calculator
This calculator will help you to calculate the P value for the given set of values with steps shown.Related Calculator:Z Score Calculator
Loading...

Neetesh Kumar | January 09, 2025
Share this Page on:
![]()
![]()
![]()
![]()
![]()
- 1. Introduction to the P Value Calculator
- 2. What is the Formulae used
- 3. How do I find the P Value?
- 4. Why choose our P Value Calculator?
- 5. A Video for explaining this concept
- 6. How to use this calculator?
- 7. Solved Examples on P Value
- 8. Frequently Asked Questions (FAQs)
- 9. What are the real-life applications?
- 10. Conclusion
The P Value is a fundamental concept in hypothesis testing, helping researchers and analysts determine the strength of evidence against a null hypothesis. The P Value Calculator for a Table streamlines this process, enabling you to compute p-values accurately and efficiently. Whether you’re a student, scientist, or data analyst, this tool simplifies your statistical analysis.
1. Introduction to the P Value Calculator
The P Value Calculator is designed to calculate the p-value from statistical tests like -tests, -tests, or -square tests. The p-value quantifies the probability of observing your data, or something more extreme, if the null hypothesis is true.
Our calculator works seamlessly with tabular data, allowing you to analyze multiple test results at once. From scientific research to business analytics, this tool is your go-to resource for statistical significance testing.
2. What is the Formulae used?
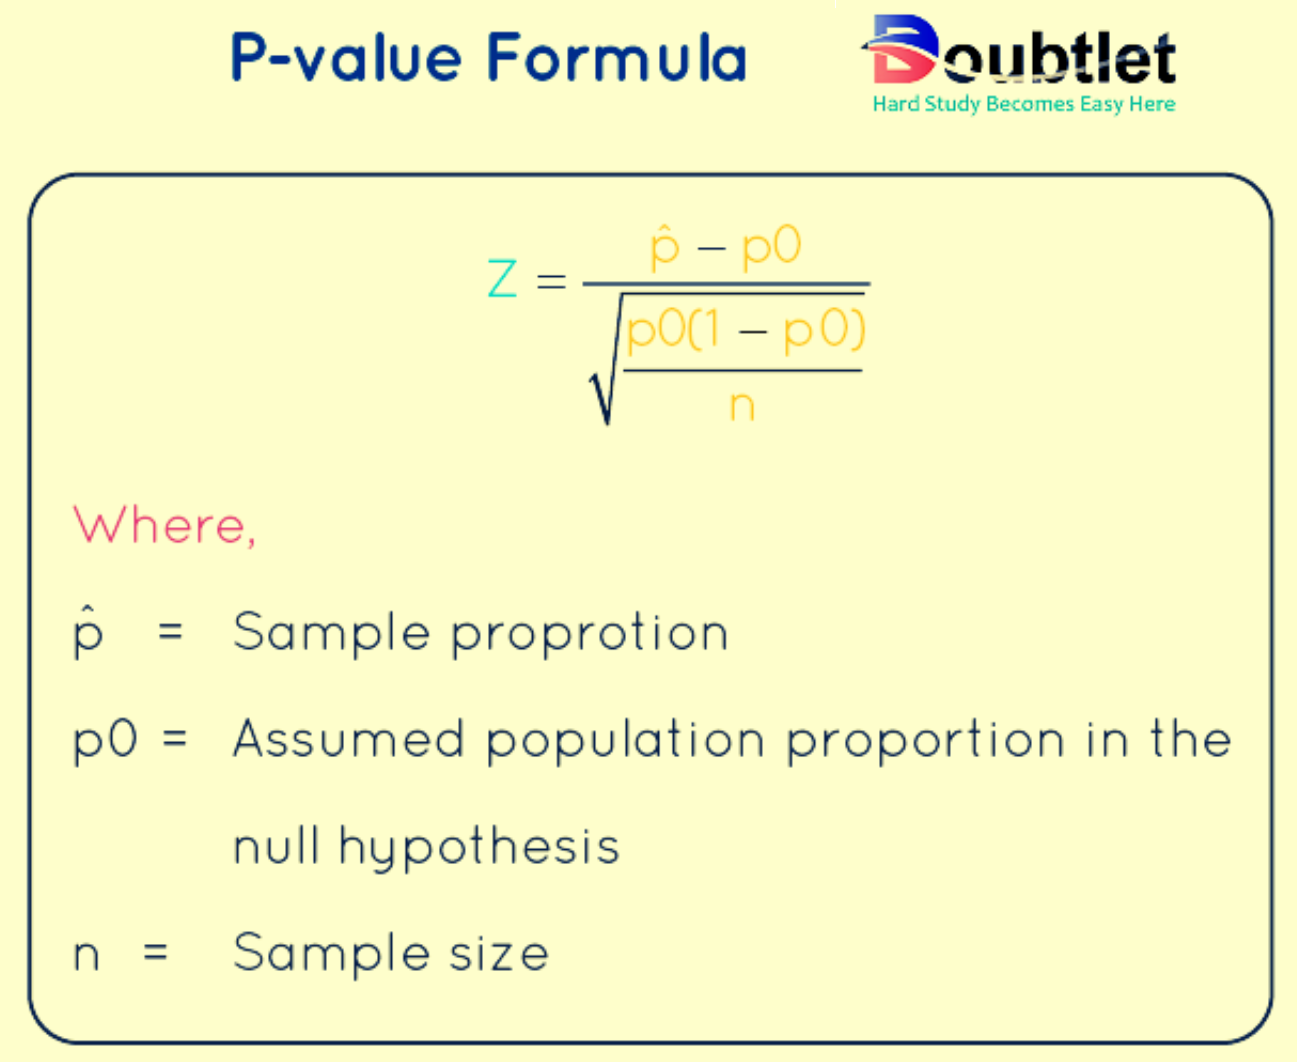
The p-value is a statistical measure that helps determine the significance of a hypothesis test. It represents the probability of observing a test statistic at least as extreme as the one calculated, assuming the null hypothesis is true.
Formula for P-Value
The formula for calculating the p-value depends on the type of test being performed (e.g., -test, -test, chi-square test). Below are some common scenarios:
1. For Z-Test (Standard Normal Distribution):
The test statistic is calculated as:
Where:
- = sample mean
- = population mean (under the null hypothesis)
- = population standard deviation
- = sample size
P-Value Calculation:
- For a one-tailed test: or
- For a two-tailed test:
You can find using standard normal tables or software like Python, R, or Excel.
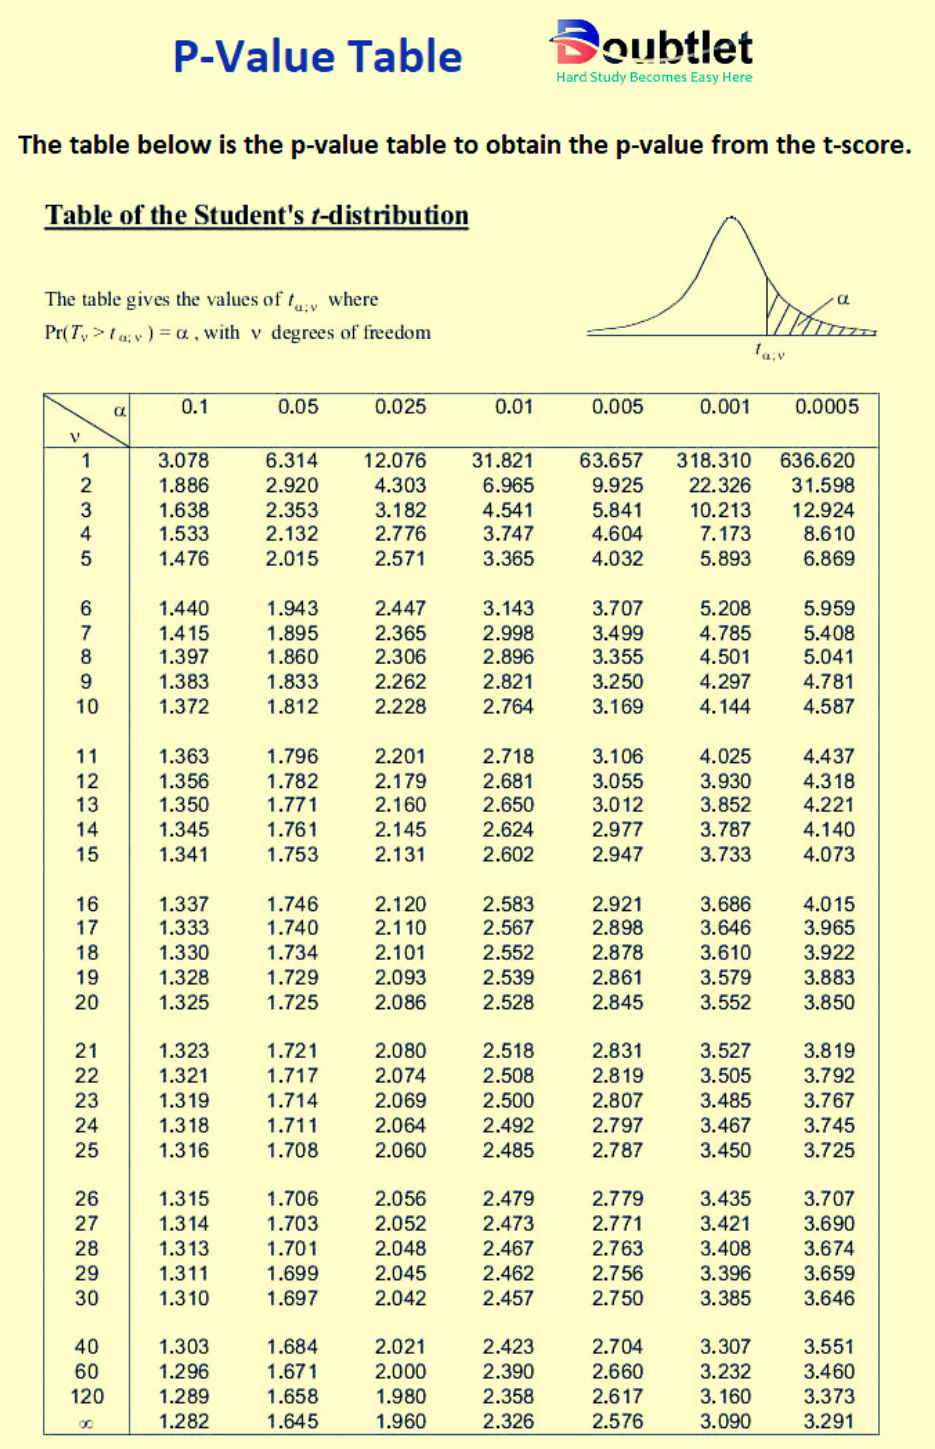
2. For T-Test (Student's t-Distribution):
The test statistic is calculated as:
Where:
- = sample mean
- = population mean (under the null hypothesis)
- = sample standard deviation
- = sample size
P-Value Calculation:
- Use the t-distribution with degrees of freedom () to find the cumulative probability.
- For a one-tailed test: or
- For a two-tailed test:
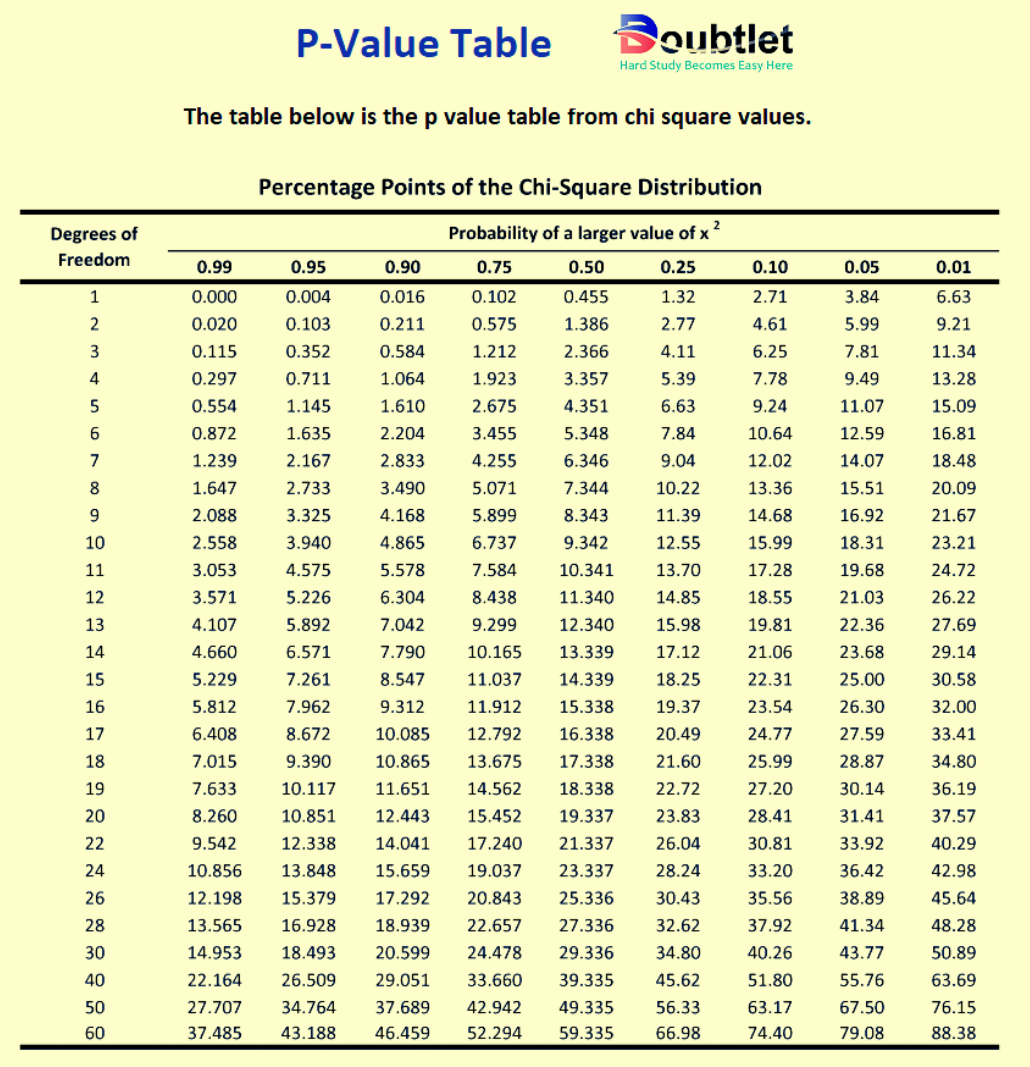
3. For Chi-Square Test:
The test statistic is calculated as:
Where:
- = observed frequency
- = expected frequency
P-Value Calculation:
- Use the chi-square distribution with degrees of freedom ( for goodness-of-fit tests, where is the number of categories).
4. For F-Test:
The test statistic is calculated as:
Where:
- and are the variances of two samples.
P-Value Calculation:
- Use the F-distribution with degrees of freedom ( and ) to find the cumulative probability.
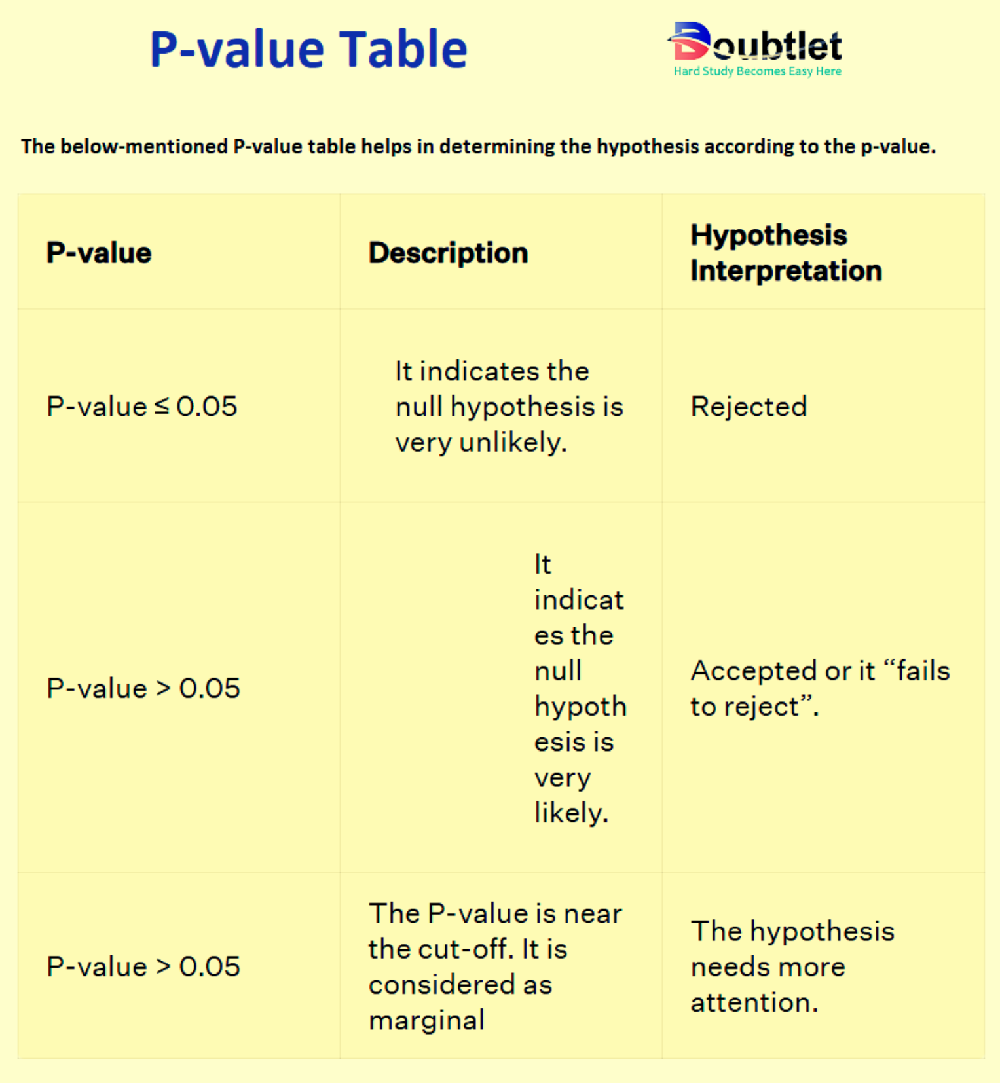
General Notes:
- Small p-value (e.g., ): Strong evidence to reject the null hypothesis.
- Large p-value (e.g., ): Insufficient evidence to reject the null hypothesis.
The exact calculation of p-values often relies on statistical software or tables, as manual computation can be complex for non-standard distributions.
3. How do I find the P Value?
To calculate the p-value manually:
- Select the Test: Choose the appropriate statistical test for your data.
- Compute the Test Statistic: Use the formula for , , or chi-square tests.
- Find the Cumulative Probability: Use standard normal or other distribution tables to find the probability corresponding to the test statistic.
- Calculate the P-Value: For two-tailed tests, double the cumulative probability.
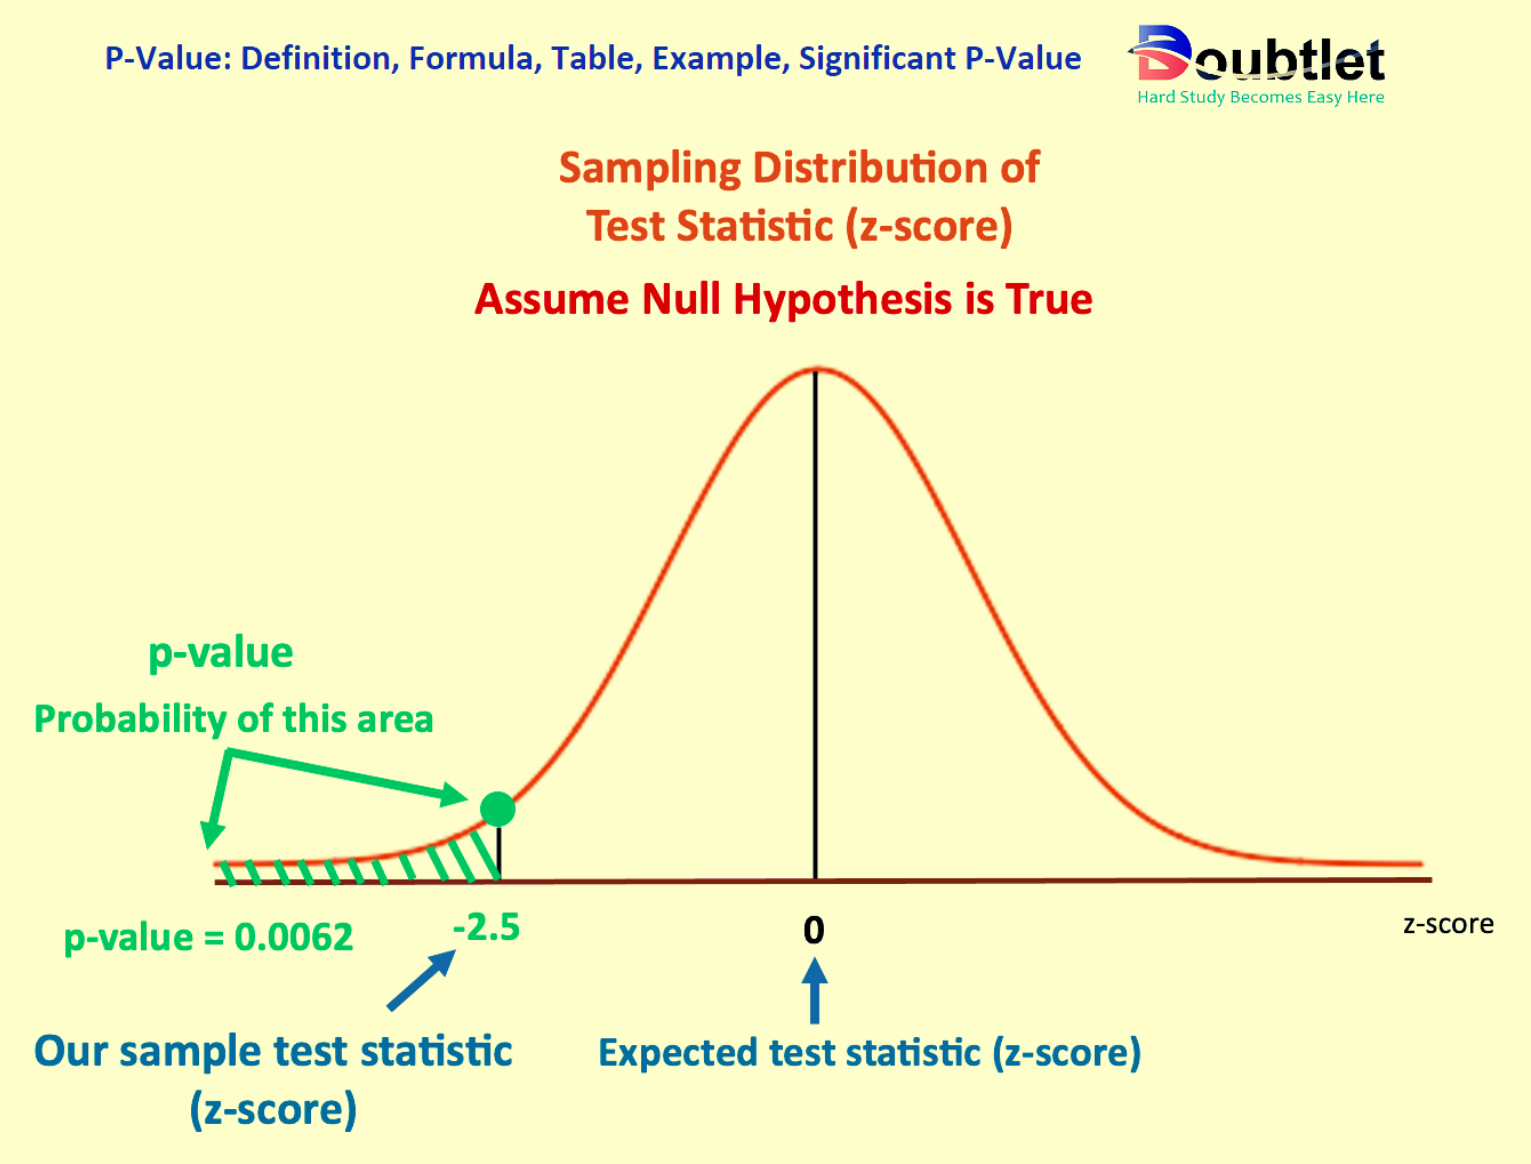
Example (Z-Test):
If :
- Find .
- P-value: .
For complex datasets or large tables, manual calculations can be tedious, but our calculator simplifies the entire process.

4. Why choose our P Value Calculator?
Our calculator page provides a user-friendly interface that makes it accessible to both students and professionals. You can quickly input your square matrix and obtain the matrix of minors within a fraction of a second.
Our calculator saves you valuable time and effort. You no longer need to manually calculate each cofactor, making complex matrix operations more efficient.
Our calculator ensures accurate results by performing calculations based on established mathematical formulas and algorithms. It eliminates the possibility of human error associated with manual calculations.
Our calculator can handle all input values like integers, fractions, or any real number.
Alongside this calculator, our website offers additional calculators related to Pre-algebra, Algebra, Precalculus, Calculus, Coordinate geometry, Linear algebra, Chemistry, Physics, and various algebraic operations. These calculators can further enhance your understanding and proficiency.
5. A video based on how to Evaluate the P Value.
6. How to use this calculator?
Using the P Value Calculator is straightforward:
- Input Data: Enter your test statistic, degrees of freedom (if applicable), and tail type (one-tailed or two-tailed).
- Choose the Test Type: Select z-test, t-test, or chi-square test.
- Click Calculate: Instantly view the p-value and interpret its significance.
Our calculator makes statistical analysis quick, easy, and accurate.
7. Solved Examples on P Value
Example 1: Z-Test
A researcher wants to test if a sample mean significantly differs from the population mean.
- Test Statistic ():
Solution:
- Compute .
- P-value: .
Result: A p-value of suggests marginal statistical significance at the level.
Example 2: Chi-Square Test
A quality control manager tests if observed defects match expected values.
- Test Statistic ():
- Degrees of Freedom ():
Solution:
- Find cumulative probability for .
- P-value: .
Result: A p-value of indicates statistical significance at the level.
Our calculator handles these calculations instantly and provides accurate results.
8. Frequently Asked Questions (FAQs)
Q1. What is a p-value?
A p-value measures the probability of obtaining your results, or more extreme ones, if the null hypothesis is true.
Q2. What does a small p-value indicate?
A small p-value (e.g., less than 0.05) suggests strong evidence against the null hypothesis.
Q3. Is this calculator free to use?
Yes, our P Value Calculator is completely free.
Q4. Can it handle large datasets?
Yes, the calculator supports extensive tabular data.
Q5. Does it work for one-tailed and two-tailed tests?
Yes, it computes p-values for both one-tailed and two-tailed tests.
Q6. Is it mobile-friendly?
Yes, the calculator works seamlessly on all devices.
Q7. Can I export results?
Yes, results can be downloaded for further analysis.
Q8. Does it show intermediate steps?
Yes, detailed steps are provided to enhance understanding.
9. What are the real-life applications?
P-values are used in a variety of fields, including:
- Scientific Research: Test hypotheses in experiments.
- Business Analytics: Evaluate marketing strategies or customer behavior.
- Healthcare: Analyze clinical trial data for new treatments.
- Education: Assess the effectiveness of teaching methods.
- Manufacturing: Monitor quality control in production processes.
Fictional Anecdote: Dr. Lisa, a biologist, uses the P Value Calculator to analyze her experiment's results. With accurate p-values, she confidently concludes that her findings are statistically significant, earning recognition in her field.
10. Conclusion
The P Value Calculator is an essential tool for anyone conducting statistical tests. It simplifies the process, provides accurate results, and helps you make data-driven decisions. Whether you’re a beginner or an expert, this calculator is designed to meet your needs.
Ready to simplify your hypothesis testing? Try our P Value Calculator today and unlock the power of statistical analysis!
If you have any suggestions regarding the improvement of the content of this page, please write to me at My Official Email Address: doubt@doubtlet.com
Are you Stuck on homework, assignments, projects, quizzes, labs, midterms, or exams?
To get connected to our tutors in real time. Sign up and get registered with us.
Beta Distribution Calculator
Poisson Distribution Calculator
Box and Whisker Plot Calculator
Z Score Calculator
Binomial Distribution Calculator
Exponential Distribution Calculator
Geometric Distribution Calculator