


Pearson Correlation Coefficient Calculator
This calculator will help you to calculate the Pearson Correlation Coefficient for the given set of values with steps shown.Related Calculators:Covariance CalculatorCoefficient of Variation Calculator

Neetesh Kumar | January 08, 2025
Share this Page on:
![]()
![]()
![]()
![]()
![]()
- 1. Introduction to the Pearson Correlation Coefficient Calculator
- 2. What is the Formulae used
- 3. How do I find the Pearson Correlation Coefficient?
- 4. Why choose our Pearson Correlation Coefficient Calculator?
- 5. A Video for explaining this concept
- 6. How to use this calculator?
- 7. Solved Examples on Pearson Correlation Coefficient
- 8. Frequently Asked Questions (FAQs)
- 9. What are the real-life applications?
- 10. Conclusion
Understanding the strength and direction of relationships between variables is crucial in statistics, research, and data analysis. The Pearson Correlation Coefficient Calculator for a Table simplifies this process, enabling you to compute correlations quickly and accurately. Whether you’re analyzing financial data, scientific experiments, or marketing trends, this tool provides valuable insights.
1. Introduction to the Pearson Correlation Coefficient Calculator
The Pearson Correlation Coefficient measures the linear relationship between two variables. It provides a value between and :
- indicates a perfect positive correlation.
- indicates a perfect negative correlation.
- indicates no correlation.
Our Pearson Correlation Coefficient Calculator is designed to work with tabular data, making it easy to assess relationships in datasets, whether small or large. From identifying market trends to analyzing test scores, this tool is an essential resource for professionals and students alike.
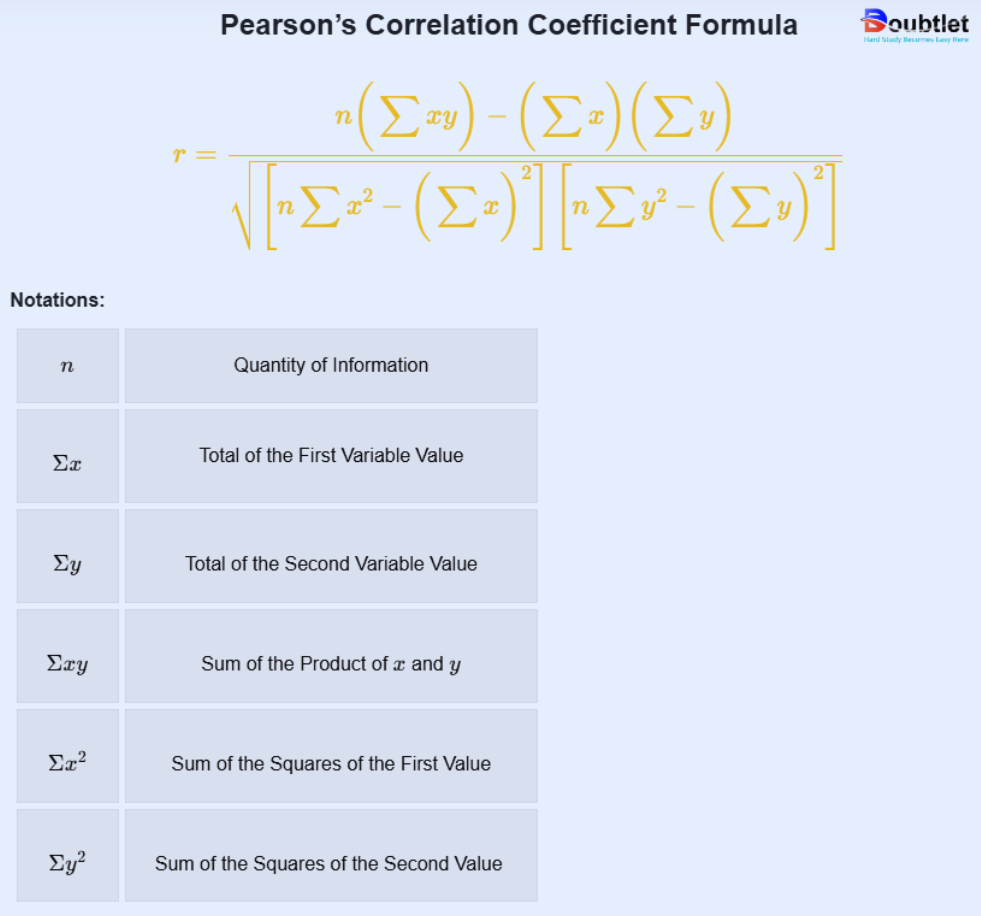
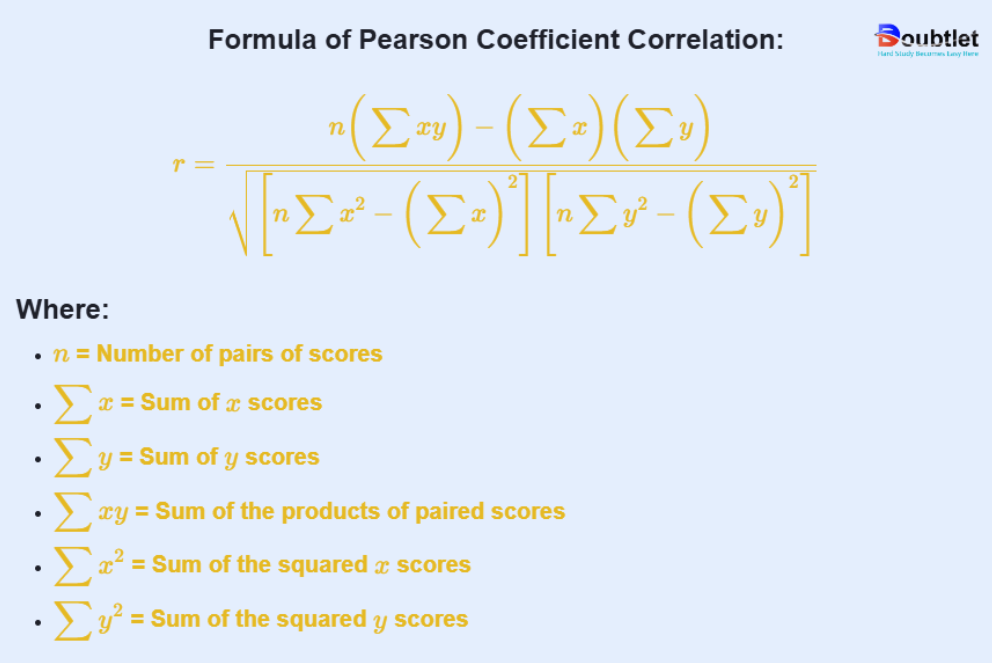
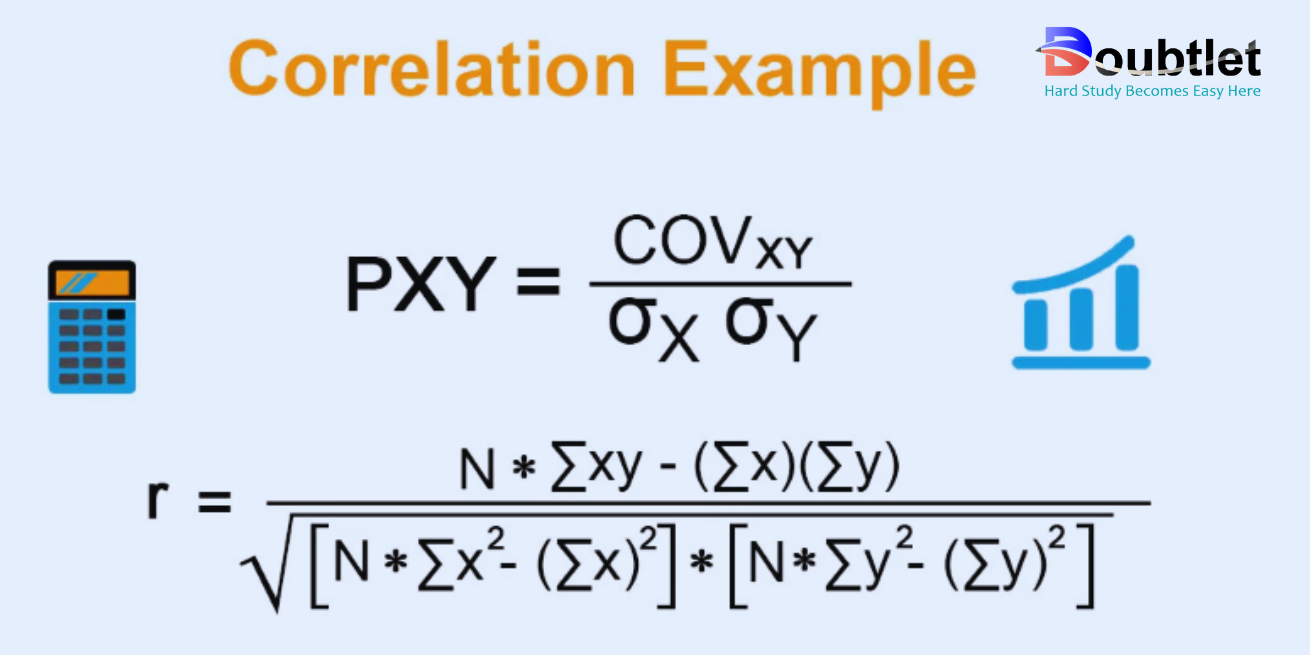
2. What is the Formulae used?
The formula for the Pearson Correlation Coefficient () is:
Where:
- : Individual data points of variables and .
- : Means (averages) of and .
This formula computes the covariance of and , divided by the product of their standard deviations, yielding a value that represents the strength and direction of their linear relationship.

3. How do I find the Pearson Correlation Coefficient?
To calculate the Pearson Correlation Coefficient manually:
- Find the Means: Compute the average of and .
- Compute Deviations: Subtract the mean from each data point.
- Multiply Deviations: Multiply the deviations of and for each pair.
- Square Deviations: Square the deviations for and separately.
- Sum and Divide: Sum the products and divide by the square root of the sum of squared deviations for and .
Example:
Dataset:
- Means:
- Deviations:
- Multiply Deviations:
- Square Deviations: for and for .
- Pearson Correlation Coefficient:
Manual calculations can be time-consuming, which is why our calculator is indispensable.
4. Why choose our Pearson Correlation Coefficient Calculator?
Our calculator page provides a user-friendly interface that makes it accessible to both students and professionals. You can quickly input your square matrix and obtain the matrix of minors within a fraction of a second.
Our calculator saves you valuable time and effort. You no longer need to manually calculate each cofactor, making complex matrix operations more efficient.
Our calculator ensures accurate results by performing calculations based on established mathematical formulas and algorithms. It eliminates the possibility of human error associated with manual calculations.
Our calculator can handle all input values like integers, fractions, or any real number.
Alongside this calculator, our website offers additional calculators related to Pre-algebra, Algebra, Precalculus, Calculus, Coordinate geometry, Linear algebra, Chemistry, Physics, and various algebraic operations. These calculators can further enhance your understanding and proficiency.
5. A video based on how to Evaluate the Pearson Correlation Coefficient.
6. How to use this calculator?
Using the Pearson Correlation Coefficient Calculator is straightforward:
- Input Your Data: Enter values for and in tabular format.
- Click Calculate: Get instant results, including the Pearson Correlation Coefficient and intermediate steps.
- Analyze Outputs: Use the coefficient value to assess the strength and direction of the relationship.
No need for complex manual calculations the calculator does the work for you.
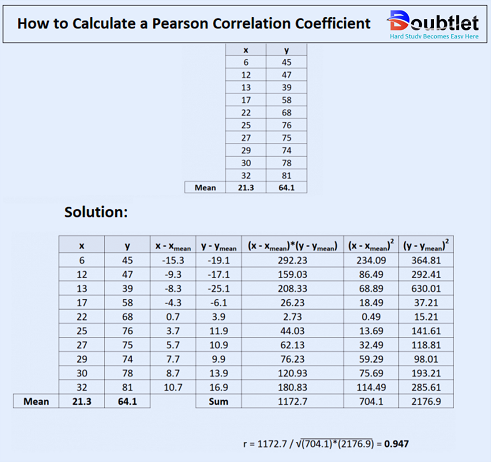
7. Solved Examples on Pearson Correlation Coefficient
Example 1:
Find the Pearson correlation coefficient between of the Dataset:
- Compute Means: .
- Deviations: .
- Multiply Deviations: .
- Pearson Correlation Coefficient: , indicating a perfect positive correlation.
The Pearson Correlation Coefficient is:
Example 2:
Find the Pearson correlation coefficient between of the Tabular Dataset:
|
|
|
| 1 | 3 |
| 2 | 6 |
| 3 | 9 |
| 4 | 12 |
Steps:
- Compute the mean and deviations for and .
- Multiply and sum the deviations.
- Calculate , confirming a perfect linear relationship.
Our calculator handles these steps with ease, providing results in seconds.
8. Frequently Asked Questions (FAQs)
Q1. What does the Pearson Correlation Coefficient measure?
It measures the strength and direction of the linear relationship between two variables.
Q2. What is the range of the coefficient?
The coefficient ranges from to .
Q3. Is the calculator free?
Yes, it’s completely free to use.
Q4. Can it handle negative correlations?
Absolutely, the calculator computes both positive and negative correlations.
Q5. Does it work for non-linear relationships?
No, Pearson Correlation is specifically for linear relationships.
Q6. Can I calculate for large datasets?
Yes, the calculator is optimized for extensive datasets.
Q7. Is the tool mobile-friendly?
Yes, it works seamlessly on any device.
Q8. Does it provide intermediate steps?
Yes, the calculator shows detailed calculations for better understanding.
9. What are the real-life applications?
Pearson Correlation Coefficient is widely used in:
- Finance: Analyze relationships between stock prices or market indicators.
- Education: Study correlations between study time and test scores.
- Healthcare: Assess connections between treatments and outcomes.
- Marketing: Evaluate relationships between advertising spend and sales.
- Social Science: Explore relationships in survey data or behavioral studies.
Fictional anecdote: Sarah, a marketing analyst, uses our calculator to evaluate the correlation between online ad spending and customer acquisition. With a strong positive correlation, she optimizes the budget for maximum ROI.
10. Conclusion
The Pearson Correlation Coefficient Calculator is an essential tool for anyone analyzing relationships between variables. It simplifies complex calculations, saves time, and delivers accurate results, making it invaluable for professionals, researchers, and students alike.
Ready to uncover insights in your data? Try our Pearson Correlation Coefficient Calculator today and take your analysis to the next level!
If you have any suggestions regarding the improvement of the content of this page, please write to me at My Official Email Address: doubt@doubtlet.com
Are you Stuck on homework, assignments, projects, quizzes, labs, midterms, or exams?
To get connected to our tutors in real time. Sign up and get registered with us.
Standard Deviation Calculator
Variance Calculator
Coefficient of Variation Calculator
Beta Distribution Calculator
Poisson Distribution Calculator
P Value Calculator
Box and Whisker Plot Calculator