


Quadratic Regression (Parabola of best fit) Calculator
This calculator will help you to calculate the best parabola fit equation for the given set of values with steps shown.Related Calculators:Linear Regression Calculator

Neetesh Kumar | January 06, 2025
Share this Page on:
![]()
![]()
![]()
![]()
![]()
- 1. Introduction to the Quadratic Regression (Parabola of best fit) Calculator
- 2. What is the Formulae used
- 3. How Do I Find the Quadratic Regression (Parabola of Best Fit)?
- 4. Why Choose Our Quadratic Regression (Parabola of Best Fit) Calculator?
- 5. A Video for explaining this concept
- 6. How to use this calculator?
- 7. Solved Examples on Quadratic Regression (Parabola of Best Fit)
- 8. Frequently Asked Questions (FAQs)
- 9. What are the real-life applications?
- 10. Conclusion
When your data isn’t following a straight line, a Quadratic Regression (Parabola of Best Fit) Calculator becomes an essential tool. This powerful tool helps you model curved relationships in data, offering accurate predictions and insights. Whether you're an academic, analyst, or business professional, this calculator simplifies quadratic regression and makes it accessible to all.
1. Introduction to the Quadratic Regression (Parabola of Best Fit) Calculator
Quadratic regression models the relationship between variables with a parabolic curve, making it ideal for datasets where linear regression falls short. The Quadratic Regression Calculator determines the equation of a parabola that best fits your data points, working seamlessly with tabular data to deliver precise results.
Imagine analyzing sales trends, where initial growth slows, peaks, and then declines. A quadratic regression model captures this non-linear relationship perfectly, allowing you to make data-driven decisions.
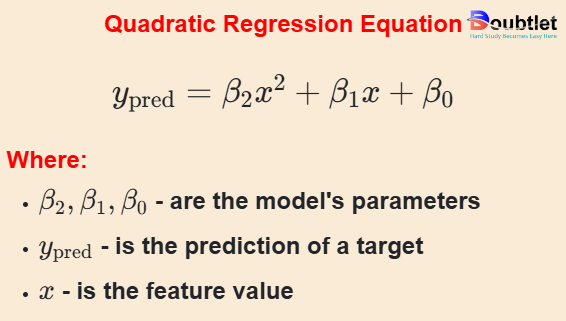
2. What is the Formulae used?
Quadratic regression is based on the equation:
Where:
-
: Dependent variable
-
: Independent variable
-
: Coefficients determined by the regression process
The coefficients are calculated using the method of least squares, minimizing the sum of squared deviations between observed values () and predicted values ().
In tabular form, the formulas to compute coefficients , , and involve solving a system of equations derived from sums of , , , , and corresponding values. These calculations are complex, but our calculator simplifies them into seconds.
3. How Do I Find the Quadratic Regression (Parabola of Best Fit)?
Finding the parabola of best fit involves these steps:
-
Prepare the Data: Organize your dataset into and values.
-
Compute Summations: Calculate sums for , , , , , , and .
-
Solve for Coefficients: Use the least-squares method to find , , and .
-
Construct the Equation: Substitute the coefficients into the quadratic equation.
Example: Dataset:
Steps:
-
Calculate necessary summations.
-
Solve the system of equations for , , and .
-
Quadratic equation: .
While manual calculations can be overwhelming, our calculator handles them effortlessly.
4. Why Choose Our Quadratic Regression (Parabola of Best Fit) Calculator?
Our calculator page provides a user-friendly interface that makes it accessible to both students and professionals. You can quickly input your square matrix and obtain the matrix of minors within a fraction of a second.
Our calculator saves you valuable time and effort. You no longer need to manually calculate each cofactor, making complex matrix operations more efficient.
Our calculator ensures accurate results by performing calculations based on established mathematical formulas and algorithms. It eliminates the possibility of human error associated with manual calculations.
Our calculator can handle all input values like integers, fractions, or any real number.
Alongside this calculator, our website offers additional calculators related to Pre-algebra, Algebra, Precalculus, Calculus, Coordinate geometry, Linear algebra, Chemistry, Physics, and various algebraic operations. These calculators can further enhance your understanding and proficiency.
5. A video based on how to Evaluate the Quadratic Regression (Parabola of Best Fit).
6. How to use this calculator?
Follow these simple steps to get started:
-
Input Your Data: Enter and values in tabular format.
-
Click Calculate: Watch as the calculator computes , , , and the equation.
-
View the Graph: Instantly visualize the parabola over your dataset.
In just three steps, you can analyze your data and unlock insights.
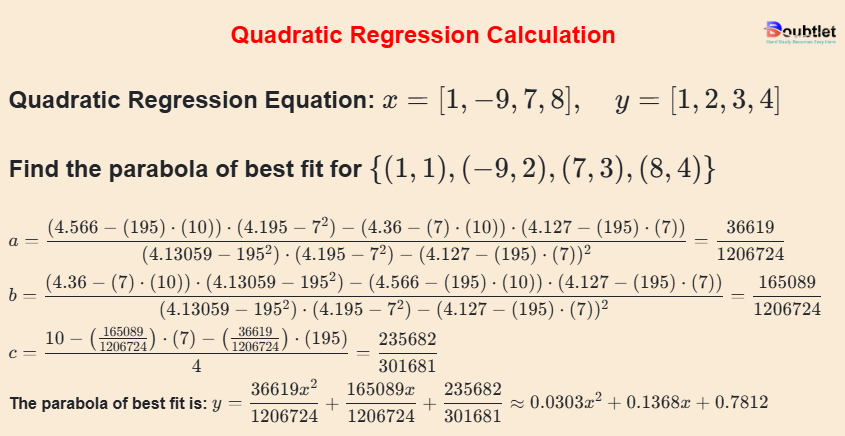
7. Solved Examples on Quadratic Regression (Parabola of Best Fit) Calculation
Example 1:
Find the parabola of best fit for the dataset .
Solution:
-
Compute summations and solve for , , .
-
Equation: .
The parabola of best fit is:
Example 2: Tabular Data:
| x | y |
| 1 | 1 |
| 4 | 7 |
| -9 | 5 |
| 16 | -8 |
Solution:
-
Compute summations and solve for , , .
-
Equation: .
The parabola of best fit is:
8. Frequently Asked Questions (FAQs)
Q1. What is quadratic regression?
It’s a statistical method to model non-linear relationships between variables using a parabolic equation.
Q2. Can the calculator handle large datasets?
Yes, it works seamlessly with extensive tabular data.
Q3. Is this tool free to use?
Absolutely, no cost involved.
Q4. Does it show graphs?
Yes, it provides a visual plot of the parabola of best fit.
Q5. Is it mobile-friendly?
Yes, it’s optimized for use on any device.
Q6. Can I adjust the step size?
Not applicable for this calculator, but it ensures high accuracy.
Q7. Does it work for all data types?
Yes, as long as the relationship is quadratic.
Q8. What if my data isn’t quadratic?
Consider using a linear or exponential regression calculator instead.
9. What are the real-life applications?
Quadratic regression is invaluable in fields like:
-
Business Analytics: Forecast sales trends with parabolic growth.
-
Physics: Model trajectories of projectiles.
-
Engineering: Analyze stress-strain relationships.
-
Agriculture: Study crop yield vs. fertilizer use.
-
Finance: Evaluate revenue growth with diminishing returns.
Fictional Anecdote: Picture Emily, a small-scale farmer analyzing her crop yield. Using the quadratic regression calculator, she identifies the optimal fertilizer usage that maximizes yield while minimizing cost. Her profits soar, and she expands her business sustainably.
10. Conclusion
The Quadratic Regression (Parabola of Best Fit) Calculator is a powerful tool for uncovering non-linear relationships in data. By automating complex calculations, it saves time, improves accuracy, and simplifies analysis for professionals and students alike.
Ready to analyze your data with precision? Try our calculator today and experience the ease of quadratic regression!
If you have any suggestions regarding the improvement of the content of this page, please write to me at My Official Email Address: doubt@doubtlet.com
Are you Stuck on homework, assignments, projects, quizzes, labs, midterms, or exams?
To get connected to our tutors in real time. Sign up and get registered with us.
Percentile Rank Calculator
Euler's Method Calculator
Root Mean Square (RMS) Value Calculator
Covariance Calculator
Standard Deviation Calculator
Variance Calculator
Pearson Correlation Coefficient Calculator