


Standard Deviation Calculator
This calculator will help you to calculate the standard deviation for the given set of values with steps shown.Related Calculators:Variance CalculatorMode Calculator

Neetesh Kumar | January 07, 2025
Share this Page on:
![]()
![]()
![]()
![]()
![]()
- 1. Introduction to the Standard Deviation Calculator
- 2. What is the Formulae used
- 3. How do I find the Standard Deviation?
- 4. Why choose our Standard Deviation Calculator?
- 5. A Video for explaining this concept
- 6. How to use this calculator?
- 7. Solved Examples on Standard Deviation
- 8. Frequently Asked Questions (FAQs)
- 9. What are the real-life applications?
- 10. Conclusion
Understanding the spread or variability of your data is critical in fields like statistics, finance, and research. The Standard Deviation Calculator for a Table simplifies this process, enabling you to compute standard deviation quickly and accurately. Whether you're a student, analyst, or researcher, this tool is a game-changer for data analysis.
1. Introduction to the Standard Deviation Calculator
Standard deviation measures how much the values in a dataset deviate from the mean (average). A smaller standard deviation indicates that the data points are closer to the mean, while a larger value signifies more variability.
Our Standard Deviation Calculator is designed for tabular data, helping you save time and reduce the risk of manual errors. From analyzing test scores to studying market trends, this tool is indispensable for anyone dealing with numbers.
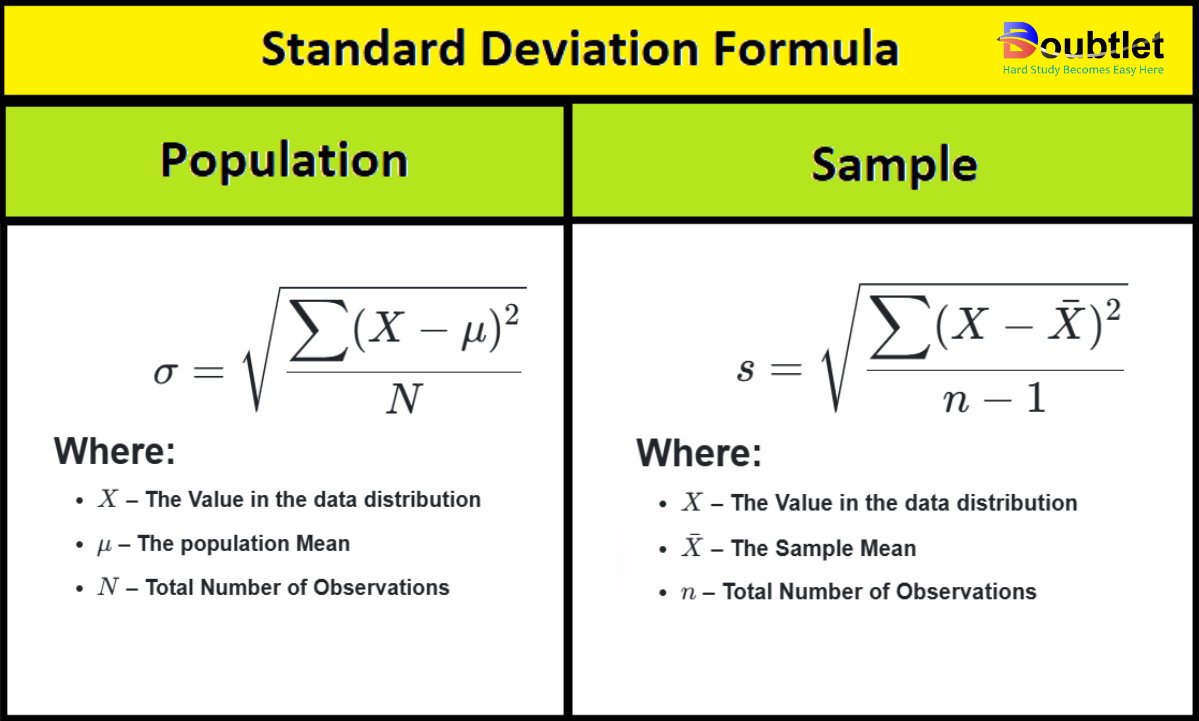
2. What is the Formulae used?
The formula for standard deviation depends on whether you’re working with a sample or an entire population.
For a population:
For a sample:
Where:
- : Individual data points
- or : Mean (average) of the dataset
- : Total number of data points in a population
- : Total number of data points in a sample
3. How Do I Find the Standard Deviation?
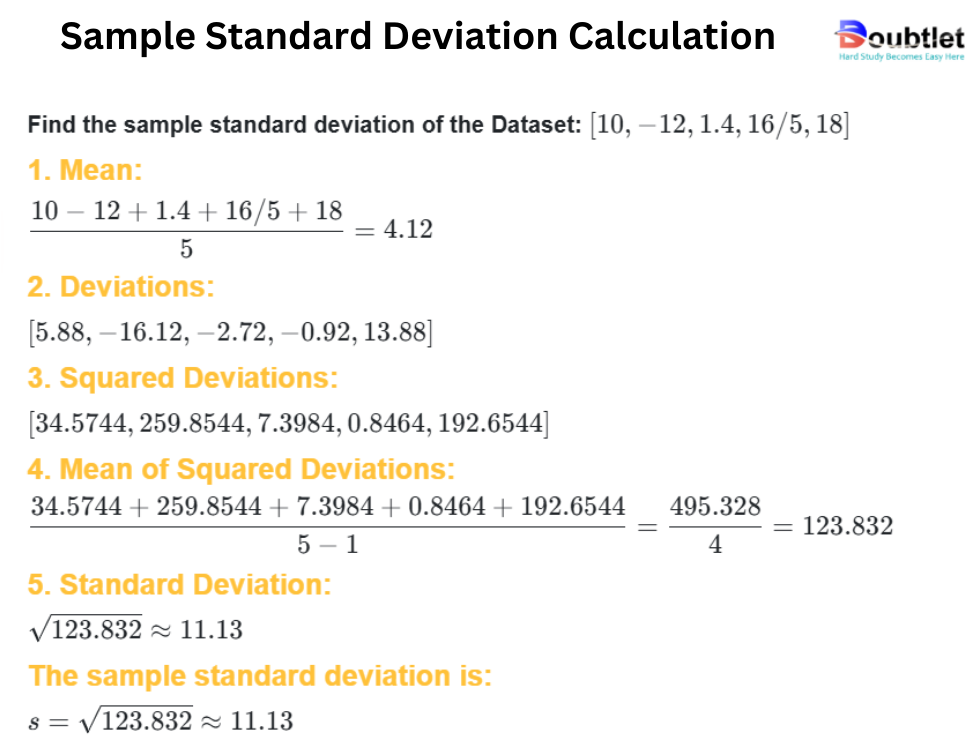
To calculate standard deviation manually:
-
Find the Mean: Add all data points and divide by the total number of values.
-
Compute Deviations: Subtract the mean from each data point.
-
Square Deviations: Square each deviation to remove negative signs.
-
Find the Mean of Squared Deviations: For a population, divide by ; for a sample, divide by .
-
Take the Square Root: Compute the square root of the result.
Example: Find the population standard deviation of the Dataset:
-
Mean:
-
Deviations:
-
Squared Deviations:
-
Mean of Squared Deviations:
-
Standard Deviation:
The population standard deviation is:
For larger datasets, manual calculations become impractical, making our calculator essential.
4. Why choose our Standard Deviation Calculator?
Our calculator page provides a user-friendly interface that makes it accessible to both students and professionals. You can quickly input your square matrix and obtain the matrix of minors within a fraction of a second.
Our calculator saves you valuable time and effort. You no longer need to manually calculate each cofactor, making complex matrix operations more efficient.
Our calculator ensures accurate results by performing calculations based on established mathematical formulas and algorithms. It eliminates the possibility of human error associated with manual calculations.
Our calculator can handle all input values like integers, fractions, or any real number.
Alongside this calculator, our website offers additional calculators related to Pre-algebra, Algebra, Precalculus, Calculus, Coordinate geometry, Linear algebra, Chemistry, Physics, and various algebraic operations. These calculators can further enhance your understanding and proficiency.
5. A video based on how to Evaluate the Standard Deviation.
6. How to use this calculator?
Using the Standard Deviation Calculator is straightforward:
-
Input Data: Enter your dataset or upload a table.
-
Choose the Type: Select whether you're calculating for a sample or population.
-
Click Calculate: View the standard deviation and related metrics instantly.
The calculator eliminates guesswork, ensuring fast and reliable results.
7. Solved Examples on Standard Deviation
Example 1:
Find the population standard deviation of the Dataset:
Solution:
-
Mean:
-
Deviations:
-
Squared Deviations:
-
Mean of Squared Deviations:
-
Standard Deviation:
The Population standard deviation is:
Example 2: Tabular Data:
| Value | Frequency |
| 2 | 3 |
| 4 | 5 |
| 6 | 2 |
Solution:
-
Mean:
-
Deviations:
-
Squared Deviations:
-
Mean of Squared Deviations:
-
Standard Deviation:
The Population standard deviation is:
Our calculator provides these results in seconds.
8. Frequently Asked Questions (FAQs)
Q1. What is standard deviation?
It measures the spread or dispersion of a dataset relative to its mean.
Q2. What’s the difference between population and sample standard deviation?
Population standard deviation divides by , while sample standard deviation divides by .
Q3. Is the calculator free?
Yes, it’s completely free to use.
Q4. Can I calculate for large datasets?
Absolutely, the calculator handles extensive datasets effortlessly.
Q5. Does the tool show intermediate steps?
Yes, it provides detailed calculations for better understanding.
Q6. Can I export results?
Yes, results can be exported in multiple formats.
Q7. Is the tool mobile-friendly?
Yes, it works seamlessly on any device.
Q8. Can I use it for grouped data?
Yes, the calculator supports grouped data.
9. What are the real-life applications?
Standard deviation is widely used across various fields:
- Finance: Assess investment risks by analyzing stock price variability.
- Education: Evaluate the spread of test scores among students.
- Engineering: Measure tolerances in manufacturing processes.
- Healthcare: Analyze variability in medical data or patient outcomes.
- Sports: Assess player performance consistency.
Fictional anecdote: Meet Jake, a financial analyst. Using our Standard Deviation Calculator, he evaluates stock performance and identifies a low-risk investment option. Thanks to his analysis, Jake’s portfolio grows steadily, cementing his reputation as a savvy investor.
10. Conclusion
The Standard Deviation Calculator is an indispensable tool for anyone analyzing data. By automating complex calculations, it saves time, improves accuracy, and simplifies statistical analysis for professionals and students alike.
Ready to understand the variability in your data? Try our Standard Deviation Calculator today and unlock valuable insights!
If you have any suggestions regarding the improvement of the content of this page, please write to me at My Official Email Address: doubt@doubtlet.com
Are you Stuck on homework, assignments, projects, quizzes, labs, midterms, or exams?
To get connected to our tutors in real time. Sign up and get registered with us.
Root Mean Square (RMS) Value Calculator
Covariance Calculator
Variance Calculator
Pearson Correlation Coefficient Calculator
Coefficient of Variation Calculator
Beta Distribution Calculator
Poisson Distribution Calculator