


Variance Calculator
This calculator will help you to calculate the variance for the given set of values with steps shown.Related Calculators:Standard Deviation CalculatorMode Calculator

Neetesh Kumar | January 07, 2025
Share this Page on:
![]()
![]()
![]()
![]()
![]()
- 1. Introduction to the Variance Calculator
- 2. What is the Formulae used
- 3. How do I find the Variance?
- 4. Why choose our Variance Calculator?
- 5. A Video for explaining this concept
- 6. How to use this calculator?
- 7. Solved Examples on Variance
- 8. Frequently Asked Questions (FAQs)
- 9. What are the real-life applications?
- 10. Conclusion
Understanding the variability in your dataset is essential for accurate statistical analysis. The Variance Calculator for a Table is your go-to tool for quickly and accurately computing variance, whether you’re working on academic projects, business analysis, or scientific research.
1. Introduction to the Variance Calculator
Variance measures the spread of data points from the mean, providing insight into how consistent or dispersed your data is. A small variance indicates that the data points are closely clustered around the mean, while a large variance shows a wider spread.
The Variance Calculator simplifies this process, allowing you to input tabular data and get results instantly. Whether you’re analyzing test scores, financial trends, or experimental data, this tool saves time and ensures precision.
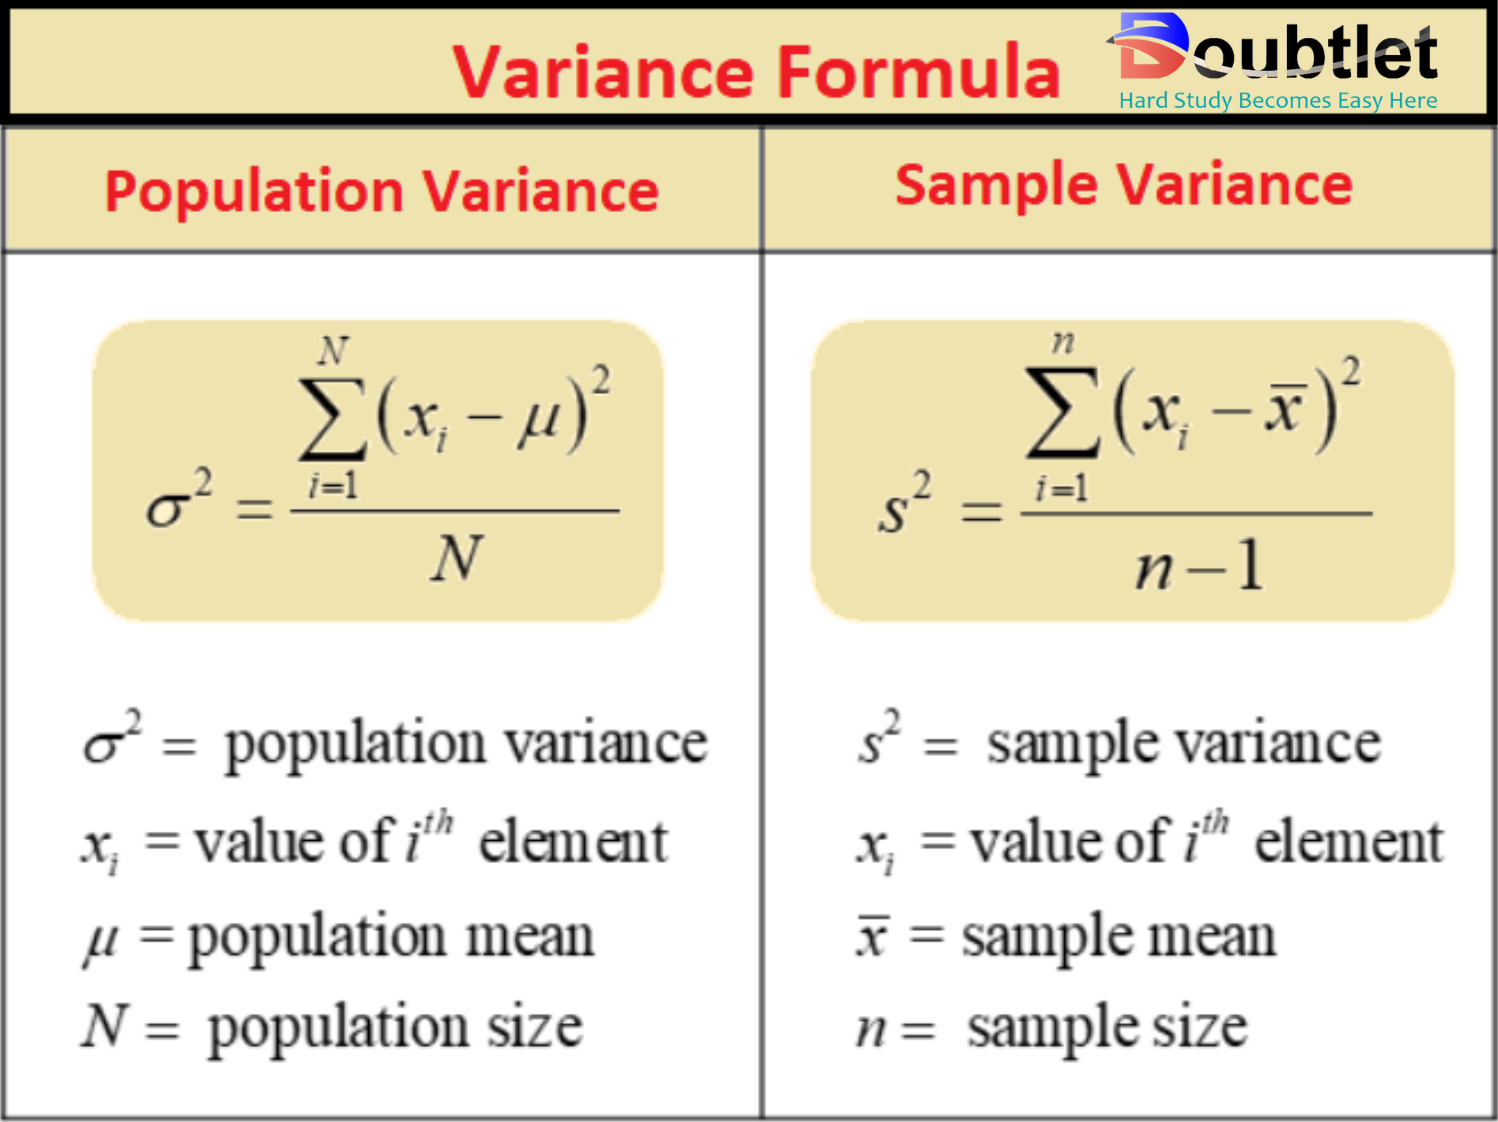
2. What is the Formulae used?
The formula for variance depends on whether you’re calculating for a population or a sample.
For a population:
For a sample:
Where:
- : Individual data points
- or : Mean (average) of the dataset
- : Total number of data points in a population
- : Total number of data points in a sample
3. How Do I Find the Variance?
To calculate variance manually:
- Find the Mean: Add all data points and divide by the total number of values.
- Compute Deviations: Subtract the mean from each data point.
- Square the Deviations: Multiply each deviation by itself.
- Find the Average: For a population, divide the sum of squared deviations by ; for a sample, divide by .
Example:
Find the population Variance of the Dataset:
-
Mean:
-
Deviations:
-
Squared Deviations:
-
Variance:
The Population Variance is:
Our Variance Calculator handles these steps automatically, providing fast and accurate results.
4. Why choose our Variance Calculator?
Our calculator page provides a user-friendly interface that makes it accessible to both students and professionals. You can quickly input your square matrix and obtain the matrix of minors within a fraction of a second.
Our calculator saves you valuable time and effort. You no longer need to manually calculate each cofactor, making complex matrix operations more efficient.
Our calculator ensures accurate results by performing calculations based on established mathematical formulas and algorithms. It eliminates the possibility of human error associated with manual calculations.
Our calculator can handle all input values like integers, fractions, or any real number.
Alongside this calculator, our website offers additional calculators related to Pre-algebra, Algebra, Precalculus, Calculus, Coordinate geometry, Linear algebra, Chemistry, Physics, and various algebraic operations. These calculators can further enhance your understanding and proficiency.
5. A video based on how to Evaluate the Variance.
6. How to use this calculator?
Using the Variance Calculator is simple:
- Input Your Data: Enter your dataset or upload a table.
- Choose the Type: Select population or sample variance.
- Click Calculate: Instantly get the variance value and detailed results.
Say goodbye to complex manual calculations and let the calculator do the heavy lifting.
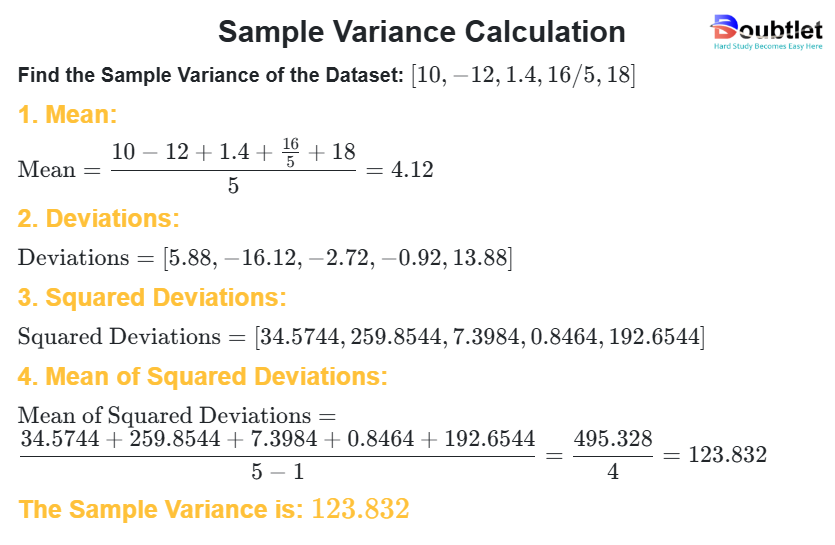
7. Solved Examples on Variance
Example 1:
Find the population Variance of the Dataset:
-
Mean:
-
Deviations:
-
Squared Deviations:
-
Variance:
The Population Variance is:
Example 2: Find the population Variance of the Tabular Dataset:
| Value | Frequency |
| 2 | 3 |
| 4 | 5 |
| 6 | 2 |
Solution:
-
Mean:
-
Deviations:
-
Squared Deviations:
-
Mean of Squared Deviations:
The Population Variance is:
Our calculator simplifies these steps, providing results in a fraction of the time.
8. Frequently Asked Questions (FAQs)
Q1. What is variance?
Variance measures how spread out data points are from the mean.
Q2. What’s the difference between population and sample variance?
Population variance divides by , while sample variance divides by to account for smaller sample sizes.
Q3. Is the Variance Calculator free?
Yes, it’s completely free to use.
Q4. Can the calculator handle large datasets?
Absolutely, it’s designed for extensive tabular data.
Q5. Does the tool provide intermediate steps?
Yes, it shows detailed calculations for better understanding.
Q6. Is the calculator mobile-friendly?
Yes, it works seamlessly on any device.
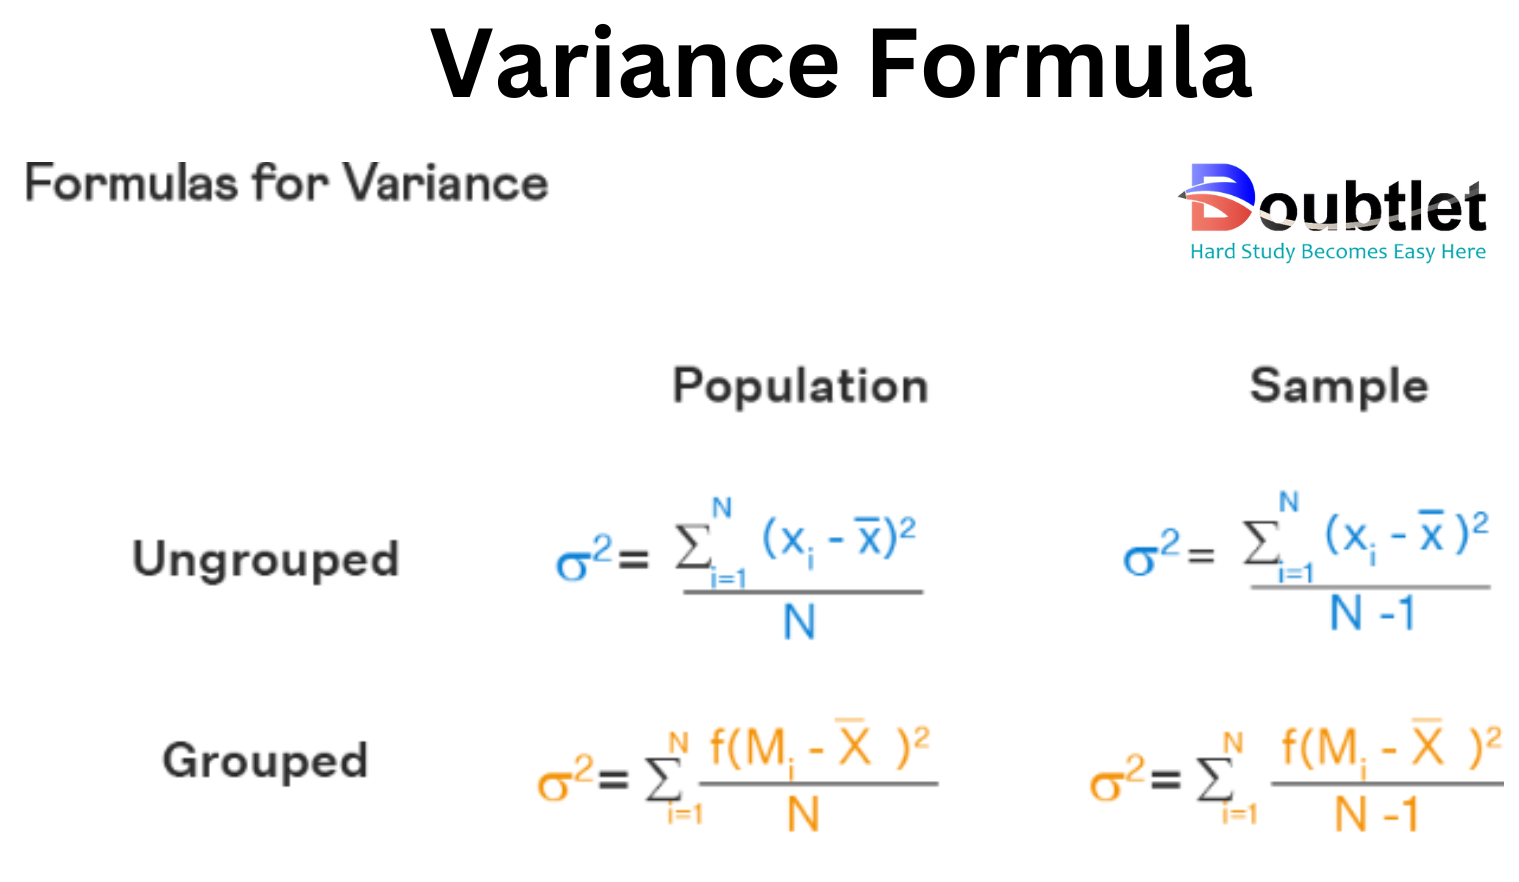
Q7. Can I calculate grouped data variance?
Yes, the calculator supports grouped data.
Q8. Can I export results?
Yes, results can be downloaded in multiple formats.
9. What are the real-life applications?
Variance is widely used in fields such as:
- Finance: Assess investment risk by analyzing stock price variability.
- Statistics: Measure data spread in surveys or experiments.
- Education: Evaluate the consistency of student test scores.
- Manufacturing: Monitor product quality by assessing variability in production.
- Healthcare: Analyze variations in patient outcomes or treatments.
Fictional anecdote: Meet Lisa, a market analyst using our Variance Calculator to assess sales variability across regions. With this insight, she identifies areas needing attention and boosts overall performance.
10. Conclusion
The Variance Calculator is an indispensable tool for anyone working with data. It simplifies complex calculations, saves time, and ensures accuracy, making it ideal for professionals, students, and researchers alike.
Ready to analyze your data like a pro? Try our Variance Calculator today and unlock meaningful insights from your numbers!
If you have any suggestions regarding the improvement of the content of this page, please write to me at My Official Email Address: doubt@doubtlet.com
Are you Stuck on homework, assignments, projects, quizzes, labs, midterms, or exams?
To get connected to our tutors in real time. Sign up and get registered with us.
Covariance Calculator
Standard Deviation Calculator
Pearson Correlation Coefficient Calculator
Coefficient of Variation Calculator
Beta Distribution Calculator
Poisson Distribution Calculator
P Value Calculator