


Z Score Calculator
This calculator will help you to calculate the Z Score for the given set of values with steps shown.Related Calculator:P Value Calculator
Loading...
Loading...
Loading...

Neetesh Kumar | January 10, 2025
Share this Page on:
![]()
![]()
![]()
![]()
![]()
- 1. Introduction to the Z Score Calculator
- 2. What is the Formulae used
- 3. How do I find the Z Score?
- 4. Why choose our Z Score Calculator?
- 5. A Video for explaining this concept
- 6. How to use this calculator?
- 7. Solved Examples on Z Score
- 8. Frequently Asked Questions (FAQs)
- 9. What are the real-life applications?
- 10. Conclusion
The Z Score is a vital concept in statistics, providing insights into how far a data point is from the mean, measured in standard deviations. The Z Score Calculator for a Table makes calculating z scores quick, accurate, and hassle-free. Whether you're analyzing test results, financial data, or experimental outcomes, this tool is your go-to for standardization.
1. Introduction to the Z Score Calculator
A Z Score (also known as a standard score) quantifies the position of a data point relative to the mean of a dataset. It helps standardize values for easier comparison across different distributions.
Our Z Score Calculator is designed for tabular data, allowing you to input multiple data points and obtain z scores instantly. From analyzing student grades to identifying stock market trends, this tool streamlines your statistical analysis.
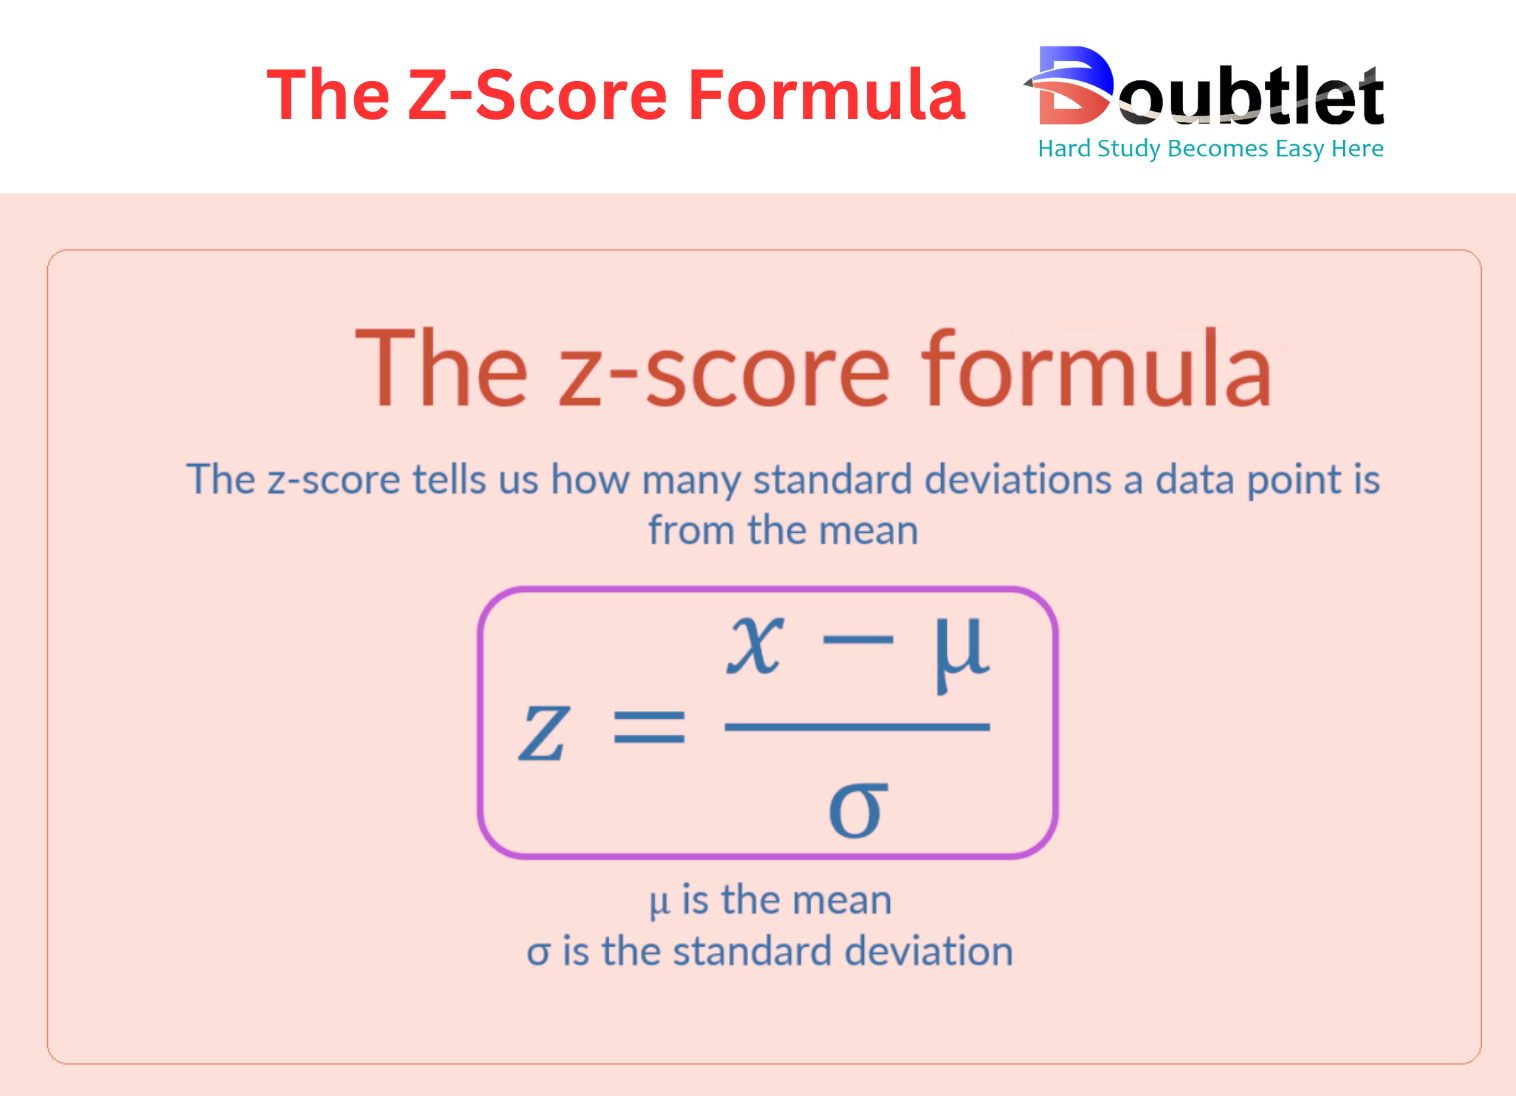
2. What is the Formulae used?
The formula for the Z Score is:
Where:
- : Z Score
- : Data point value
- : Mean of the dataset
- : Standard deviation of the dataset
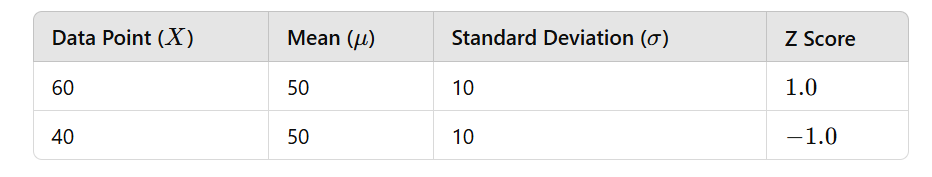
The formula standardizes the value by showing how many standard deviations it is from the mean. Positive z scores indicate values above the mean, while negative z scores indicate values below it.
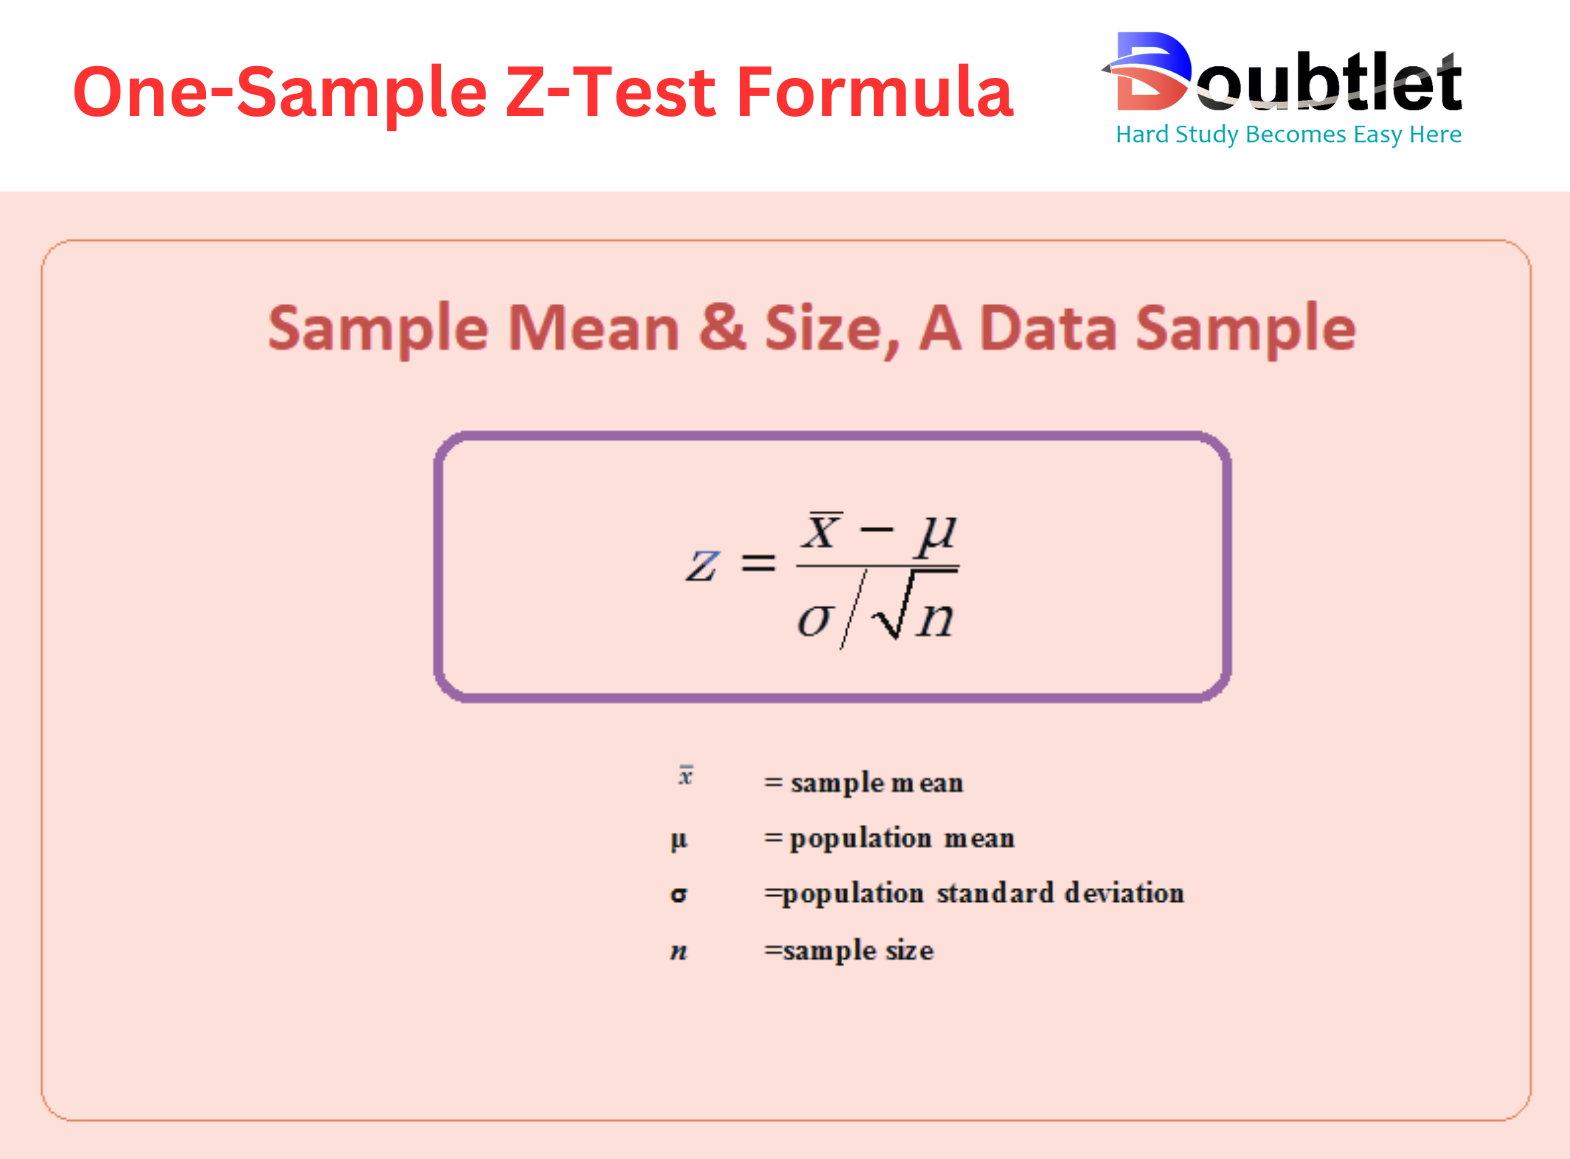
One-Sample Z-Test
Where:
- : Sample mean
- : Population mean
- : Population standard deviation
- : Sample size
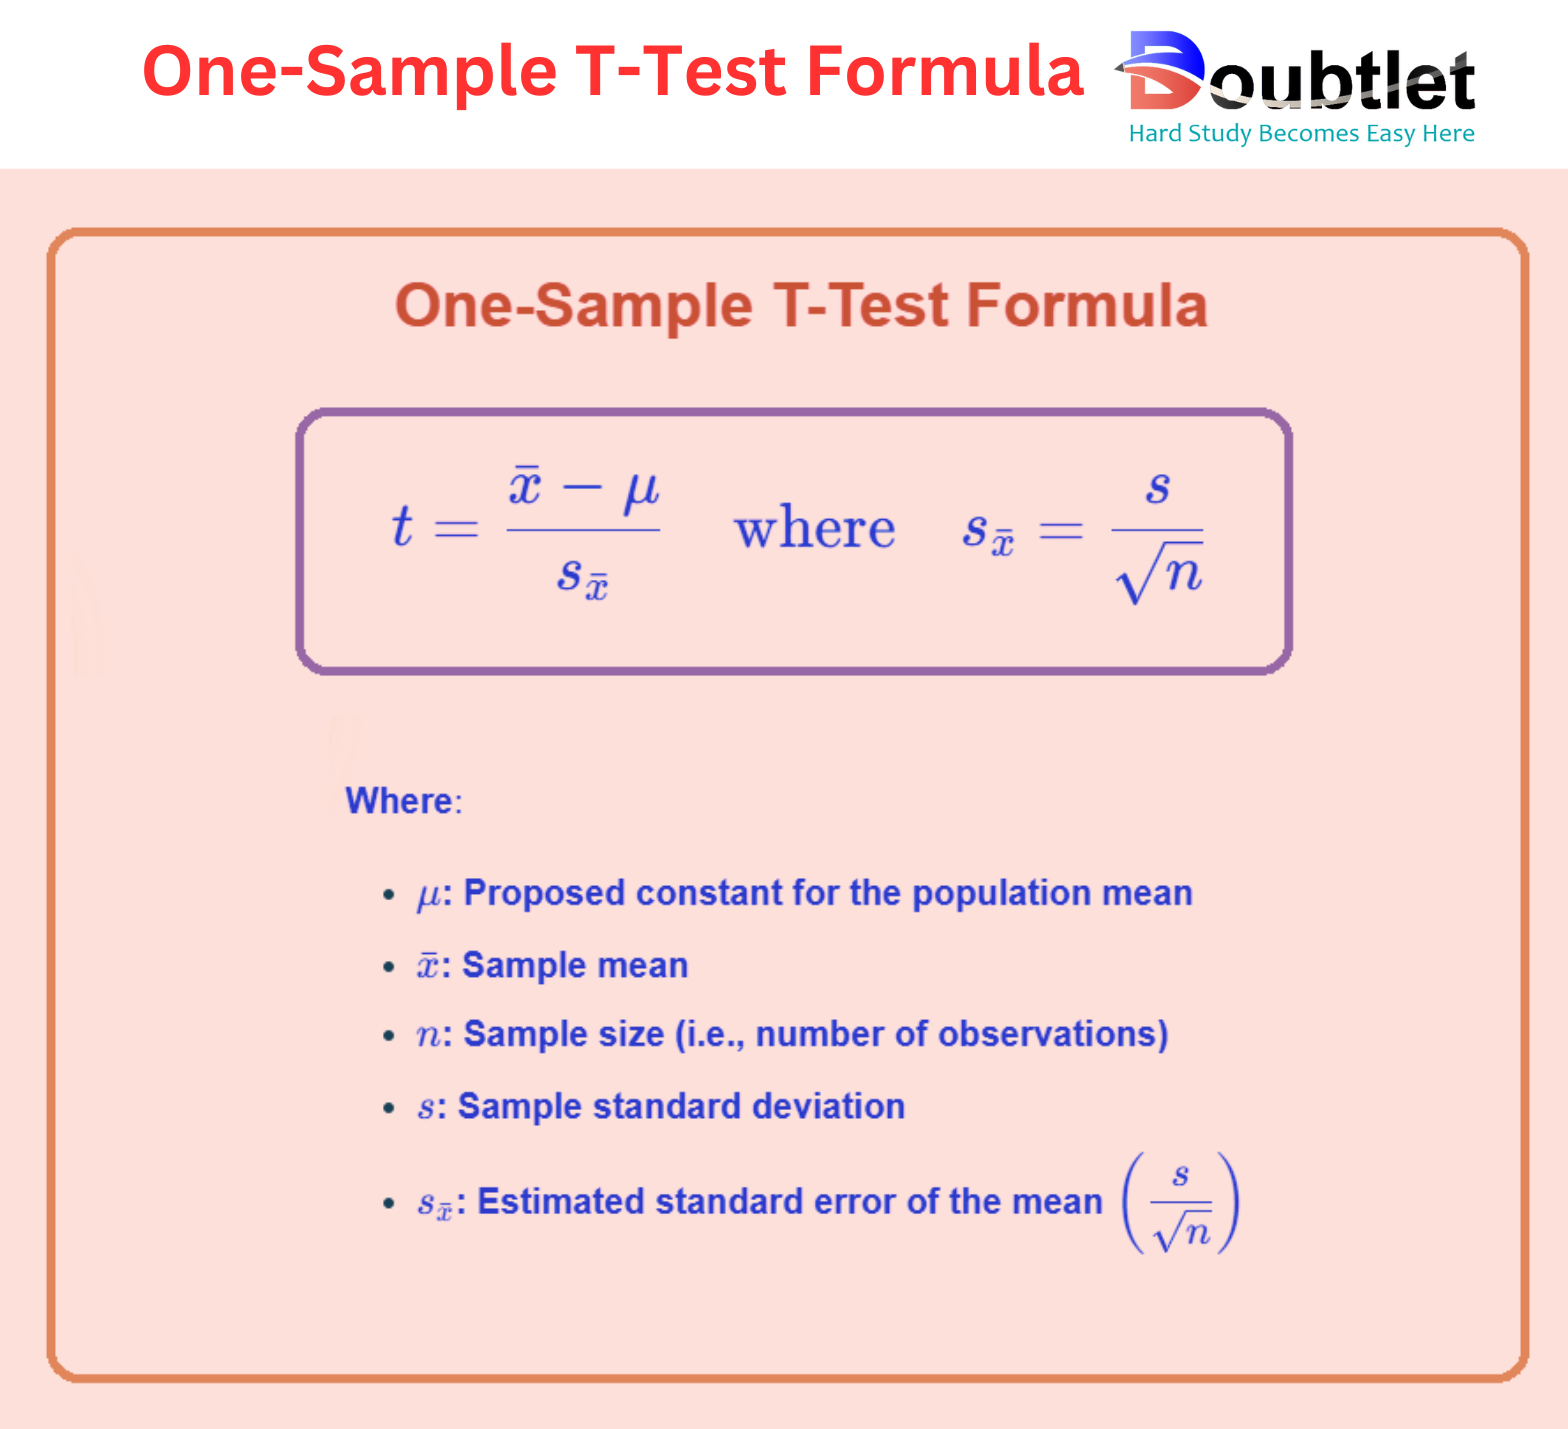
One-Sample T-Test
Where:
- : Proposed constant for the population mean
- : Sample mean
- : Sample size (i.e., number of observations)
- : Sample standard deviation
- : Estimated standard error of the mean
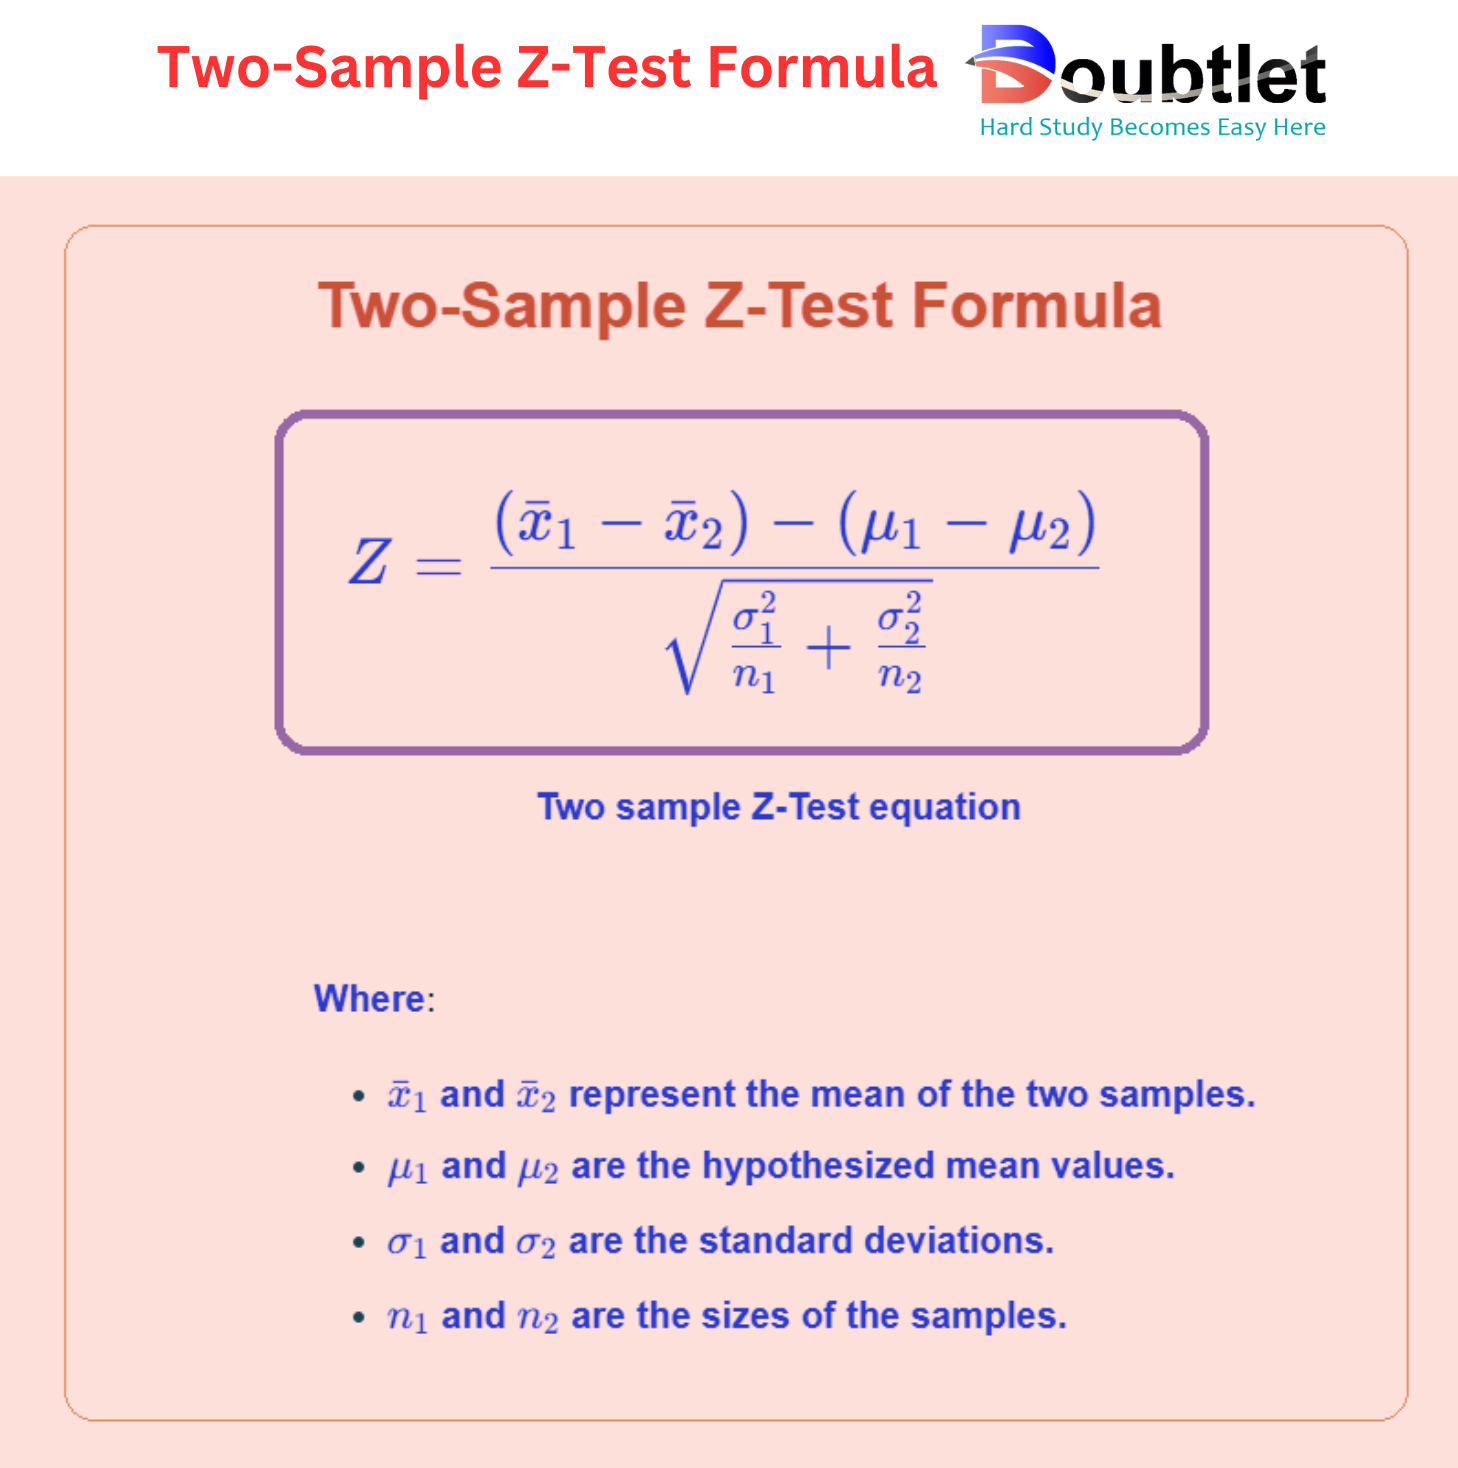
Two-Sample Z-Test
The equation for finding the value of is:
Two sample Z-Test equation
Where:
- and represent the mean of the two samples.
- and are the hypothesized mean values.
- and are the standard deviations.
- and are the sizes of the samples.
3. How Do I Find the Z Score?
To calculate a Z Score manually:
- Find the Mean (): Add all data points and divide by the total number of points.
- Calculate the Standard Deviation ():
- Subtract the mean from each data point.
- Square the results.
- Find the mean of these squared deviations and take the square root.
- Apply the Formula: Subtract the mean from the data point () and divide by the standard deviation.
Example:
Dataset:
- Mean:
- Standard Deviation:
- Z Score for :
Our Z Score Calculator automates these calculations, providing accurate results in seconds.
The Probability Density Function of the Z-Distribution
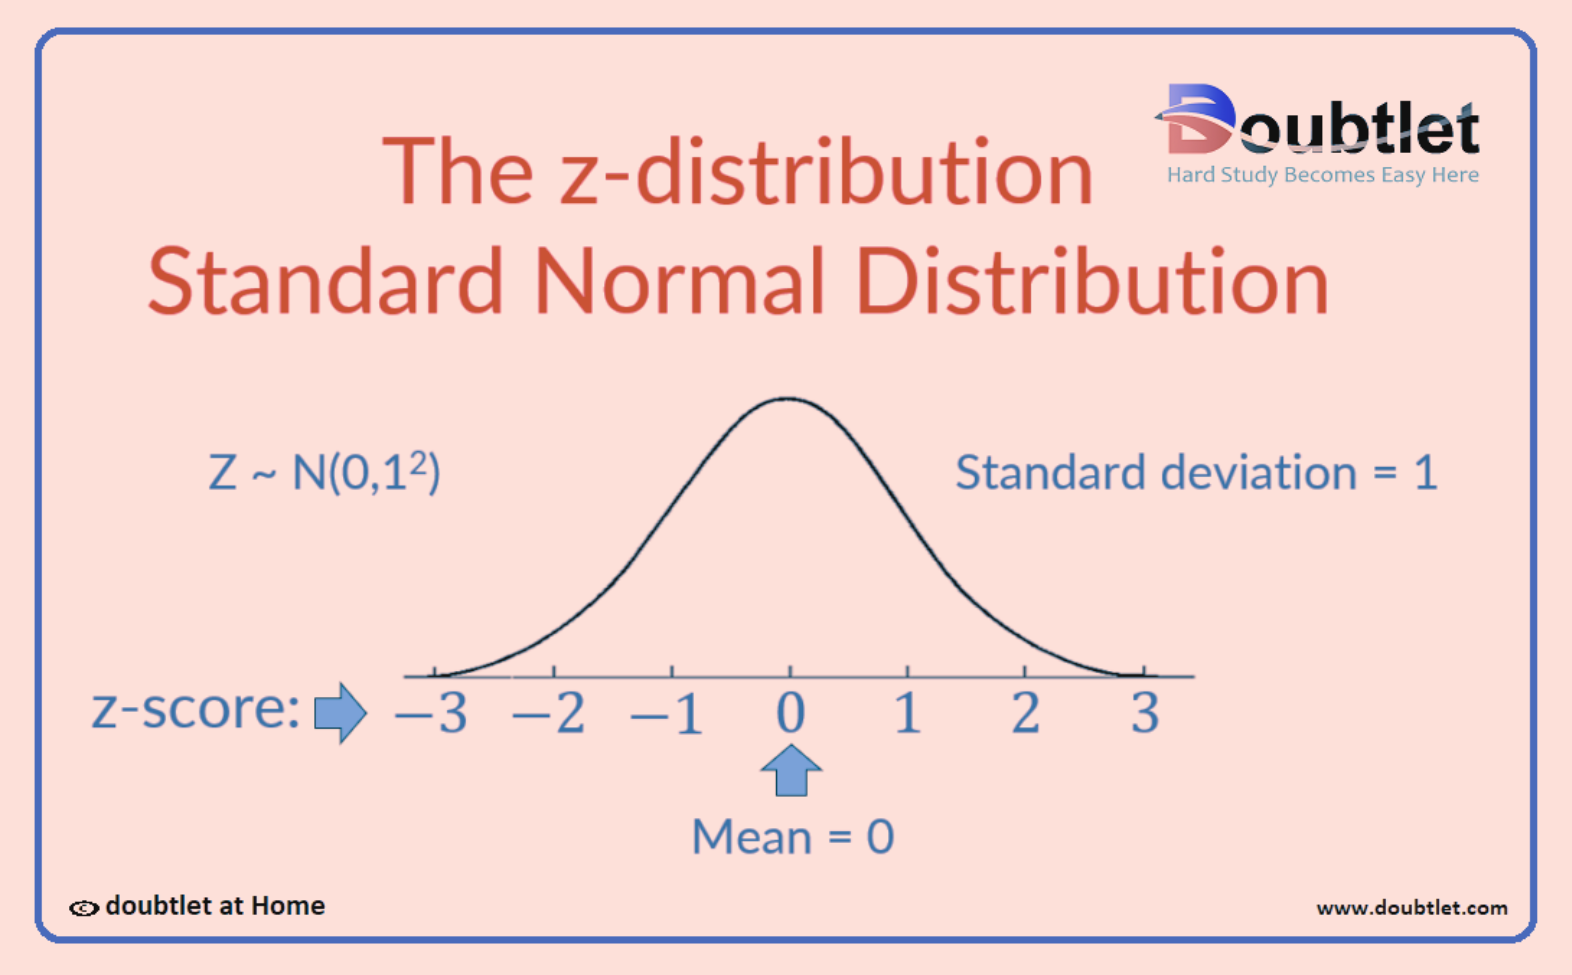
The z-score can be used to normalize a set of values in a normal distribution by calculating the z-score of every value in the dataset. This results in a mean of and a standard deviation of . The resulting distribution is known as a standard normal distribution.
The probability density function for the standard normal distribution is:
The standard normal distribution is a normal distribution with a mean of and a standard deviation of .
Consider the following examples:
My time to run is . The mean time for this race is and the standard deviation is .
My time to run is . The mean time for this race is and the standard deviation is .
Calculate the z-score for each race.
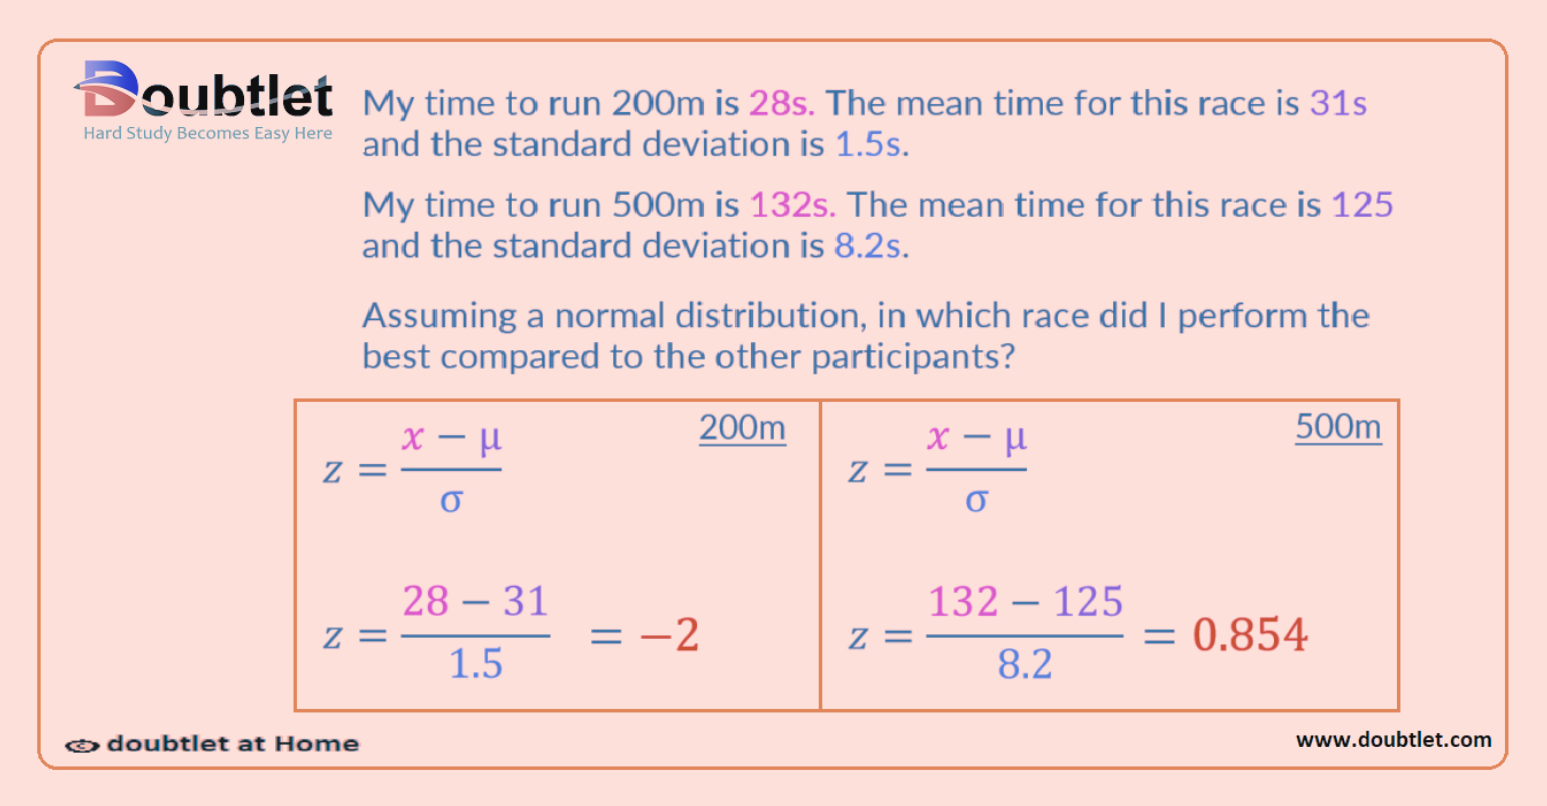
In the 200m race:
- The raw score,
- The mean,
- The standard deviation,
and divided by .
For the race, .
For the 500m race:
- The raw score,
- The mean,
- The standard deviation,
and divided by .
For the race, .
How to Interpret Z-Scores
The z-score is used to normalize data with different means and standard deviations. This allows data to be compared even if they have different parameters. The z-score of multiple datasets can be found, and the larger the z-score, the greater its position above the mean.
Consider the following examples:
My time to run is . The mean time for this race is and the standard deviation is .
My time to run is . The mean time for this race is and the standard deviation is .
- For the race, the z-score is .
- For the race, the z-score is .
This means that the time in the race is two standard deviations less than the mean time.
We can see that the mean is and the standard deviation is .
Subtracting two lots of the standard deviation from the mean, we obtain the raw score:
In the race, the time is standard deviations above the mean.
We can see that the mean is and the standard deviation is .
We can add lots of the standard deviation to obtain the raw score:
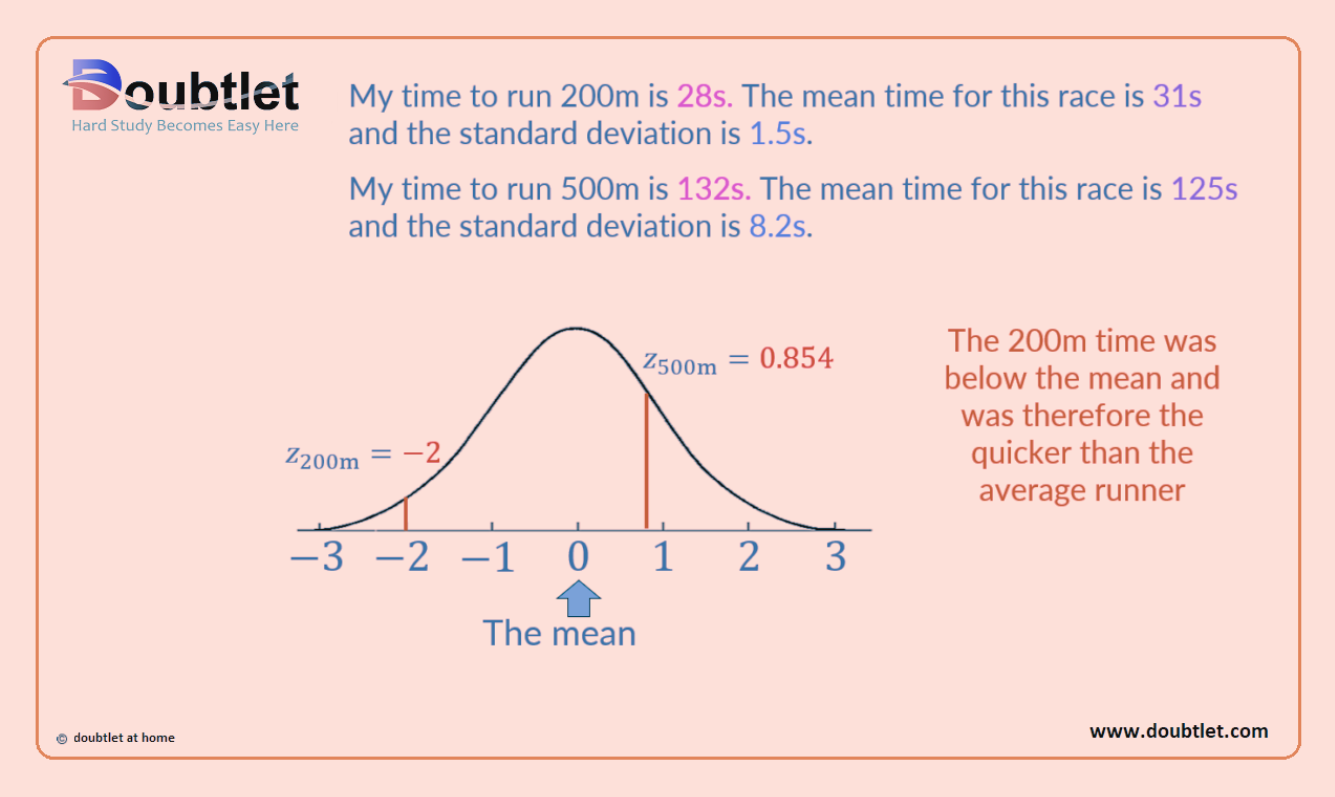
We can see that the z-score of corresponds to a time that is less than the mean time and is located on the left of the mean.
The z-score of corresponds to a time that is greater than the mean time and is located on the right of the mean.
In this example, a lower time would be preferable when completing a race, and so, the lower z-score would be best.
This process allows for a comparison to be made between the two races despite different mean times and standard deviations.
4. Why Choose Our Z Score Calculator?
Our calculator page provides a user-friendly interface that makes it accessible to both students and professionals. You can quickly input your square matrix and obtain the matrix of minors within a fraction of a second.
Our calculator saves you valuable time and effort. You no longer need to manually calculate each cofactor, making complex matrix operations more efficient.
Our calculator ensures accurate results by performing calculations based on established mathematical formulas and algorithms. It eliminates the possibility of human error associated with manual calculations.
Our calculator can handle all input values like integers, fractions, or any real number.
Alongside this calculator, our website offers additional calculators related to Pre-algebra, Algebra, Precalculus, Calculus, Coordinate geometry, Linear algebra, Chemistry, Physics, and various algebraic operations. These calculators can further enhance your understanding and proficiency.
5. A video based on how to Evaluate the Z Score.
6. How to use this calculator?
Using the Z Score Calculator is straightforward:
- Input Data: Enter your data points, mean, and standard deviation.
- Click Calculate: Instantly get the z scores for each data point.
- Analyze Results: Use the z scores to interpret your dataset.
This tool saves time and ensures accurate standardization.
7. Solved Examples on Z Score
Example 1:
Dataset: [15, 20, 25, 30, 35]
Find the z score for .
Solution:
-
Mean:
-
Standard Deviation:
-
Z Score:
Example 2: Tabular Data:
Our calculator handles these computations instantly, even for large datasets.
8. Frequently Asked Questions (FAQs)
Q1. What is a Z Score?
A Z Score measures how many standard deviations a data point is from the mean.
Q2. What does a positive z score indicate?
A positive z score indicates that the data point is above the mean.
Q3. Is the Z Score Calculator free?
Yes, it’s completely free to use.
Q4. Can I calculate z scores for grouped data?
Yes, the calculator supports grouped and tabular data.
Q5. Does the calculator handle large datasets?
Absolutely, it’s optimized for extensive datasets.
Q6. Is the tool mobile-friendly?
Yes, it works seamlessly on any device.
Q7. Can I export the results?
Yes, you can download the z score outputs for further analysis.
Q8. Does it show intermediate calculations?
Yes, the calculator provides detailed steps for transparency.
9. What are the real-life applications?
Z Scores are widely used in:
- Education: Standardize test scores for comparisons.
- Finance: Analyze stock performance relative to market trends.
- Healthcare: Assess patient health metrics against population norms.
- Sports: Compare athlete performance.
- Research: Detect outliers in experimental data.
Fictional Anecdote: Dr. Emma, a biostatistician, uses our Z Score Calculator to standardize patient blood pressure readings across age groups. With these insights, she identifies at-risk patients and improves treatment plans.
10. Conclusion
The Z Score Calculator is a powerful tool for anyone needing to standardize data or assess variability. It simplifies complex calculations, provides accurate results, and saves time, making it essential for professionals, students, and researchers.
Ready to analyze your data with precision? Try our Z Score Calculator today and take your statistical skills to the next level!
If you have any suggestions regarding the improvement of the content of this page, please write to me at My Official Email Address: doubt@doubtlet.com
Are you Stuck on homework, assignments, projects, quizzes, labs, midterms, or exams?
To get connected to our tutors in real time. Sign up and get registered with us.
P Value Calculator
Box and Whisker Plot Calculator
Binomial Distribution Calculator
Exponential Distribution Calculator
Geometric Distribution Calculator
Margin of Error Calculator
Decimal to Percent calculator