


Question :
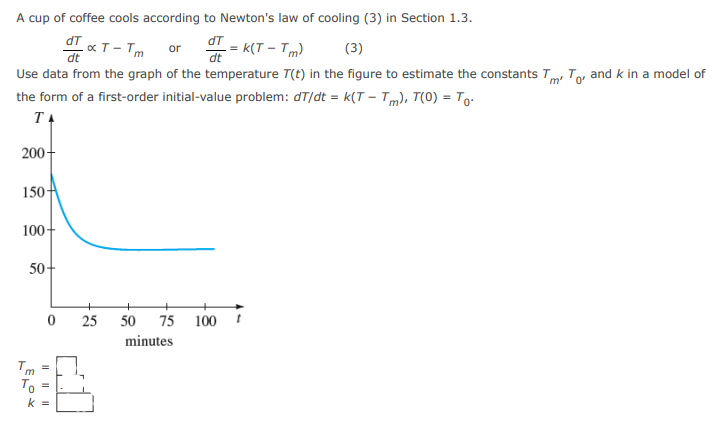
A cup of coffee cools according to newton's law of cooling (3) in section 1.3.
using data from the temperature graph provided in the figure, we need to estimate the constants , , and in the model of the form:
Solution:

Neetesh Kumar | November 08, 2024
Differential Equation Homework Help
This is the solution to Math 2A, section 13Z, Fall 2023 | WebAssign
Math002ACh1Sec03 (Homework) Question - 2
Contact me if you need help with Homework, Assignments, Tutoring Sessions, or Exams for STEM subjects.
You can see our Testimonials or Vouches from here of the previous works I have done.
Step-by-Step-Solution:
- is the temperature of the coffee,
- is the ambient temperature,
- is a constant that depends on the characteristics of the coffee and the environment.
Step 1: Determine Constants from the Graph
-
Estimate :
- represents the ambient temperature. From the graph, the temperature approaches a constant value as increases. This value is .
- For example, if the graph stabilizes around after sufficient time, we estimate:
-
Estimate :
- is the initial temperature of the coffee at . From the graph, find the value of at .
- For instance, if is around :
-
Estimate :
- To estimate , we need to use the cooling data. Select two points from the graph to find the slope of at a specific time.
- If we have a point and another point , we can calculate the average rate of change of temperature over that time interval:
Conclusion
Using the estimates obtained from the graph:
Please comment below if you find any error in this solution.
If this solution helps, then please share this with your friends.
Please subscribe to my Youtube channel for video solutions to similar questions.
Keep Smiling :-)
Comments(0)

Copyright ©2025 Doubtlet. All rights reserved by Doubtlet
Leave a comment